
Prometheus & Grafana Monitoring
After deploying the Monkeys application, you can monitor the running status and performance metrics of Monkeys services using Prometheus & Grafana.
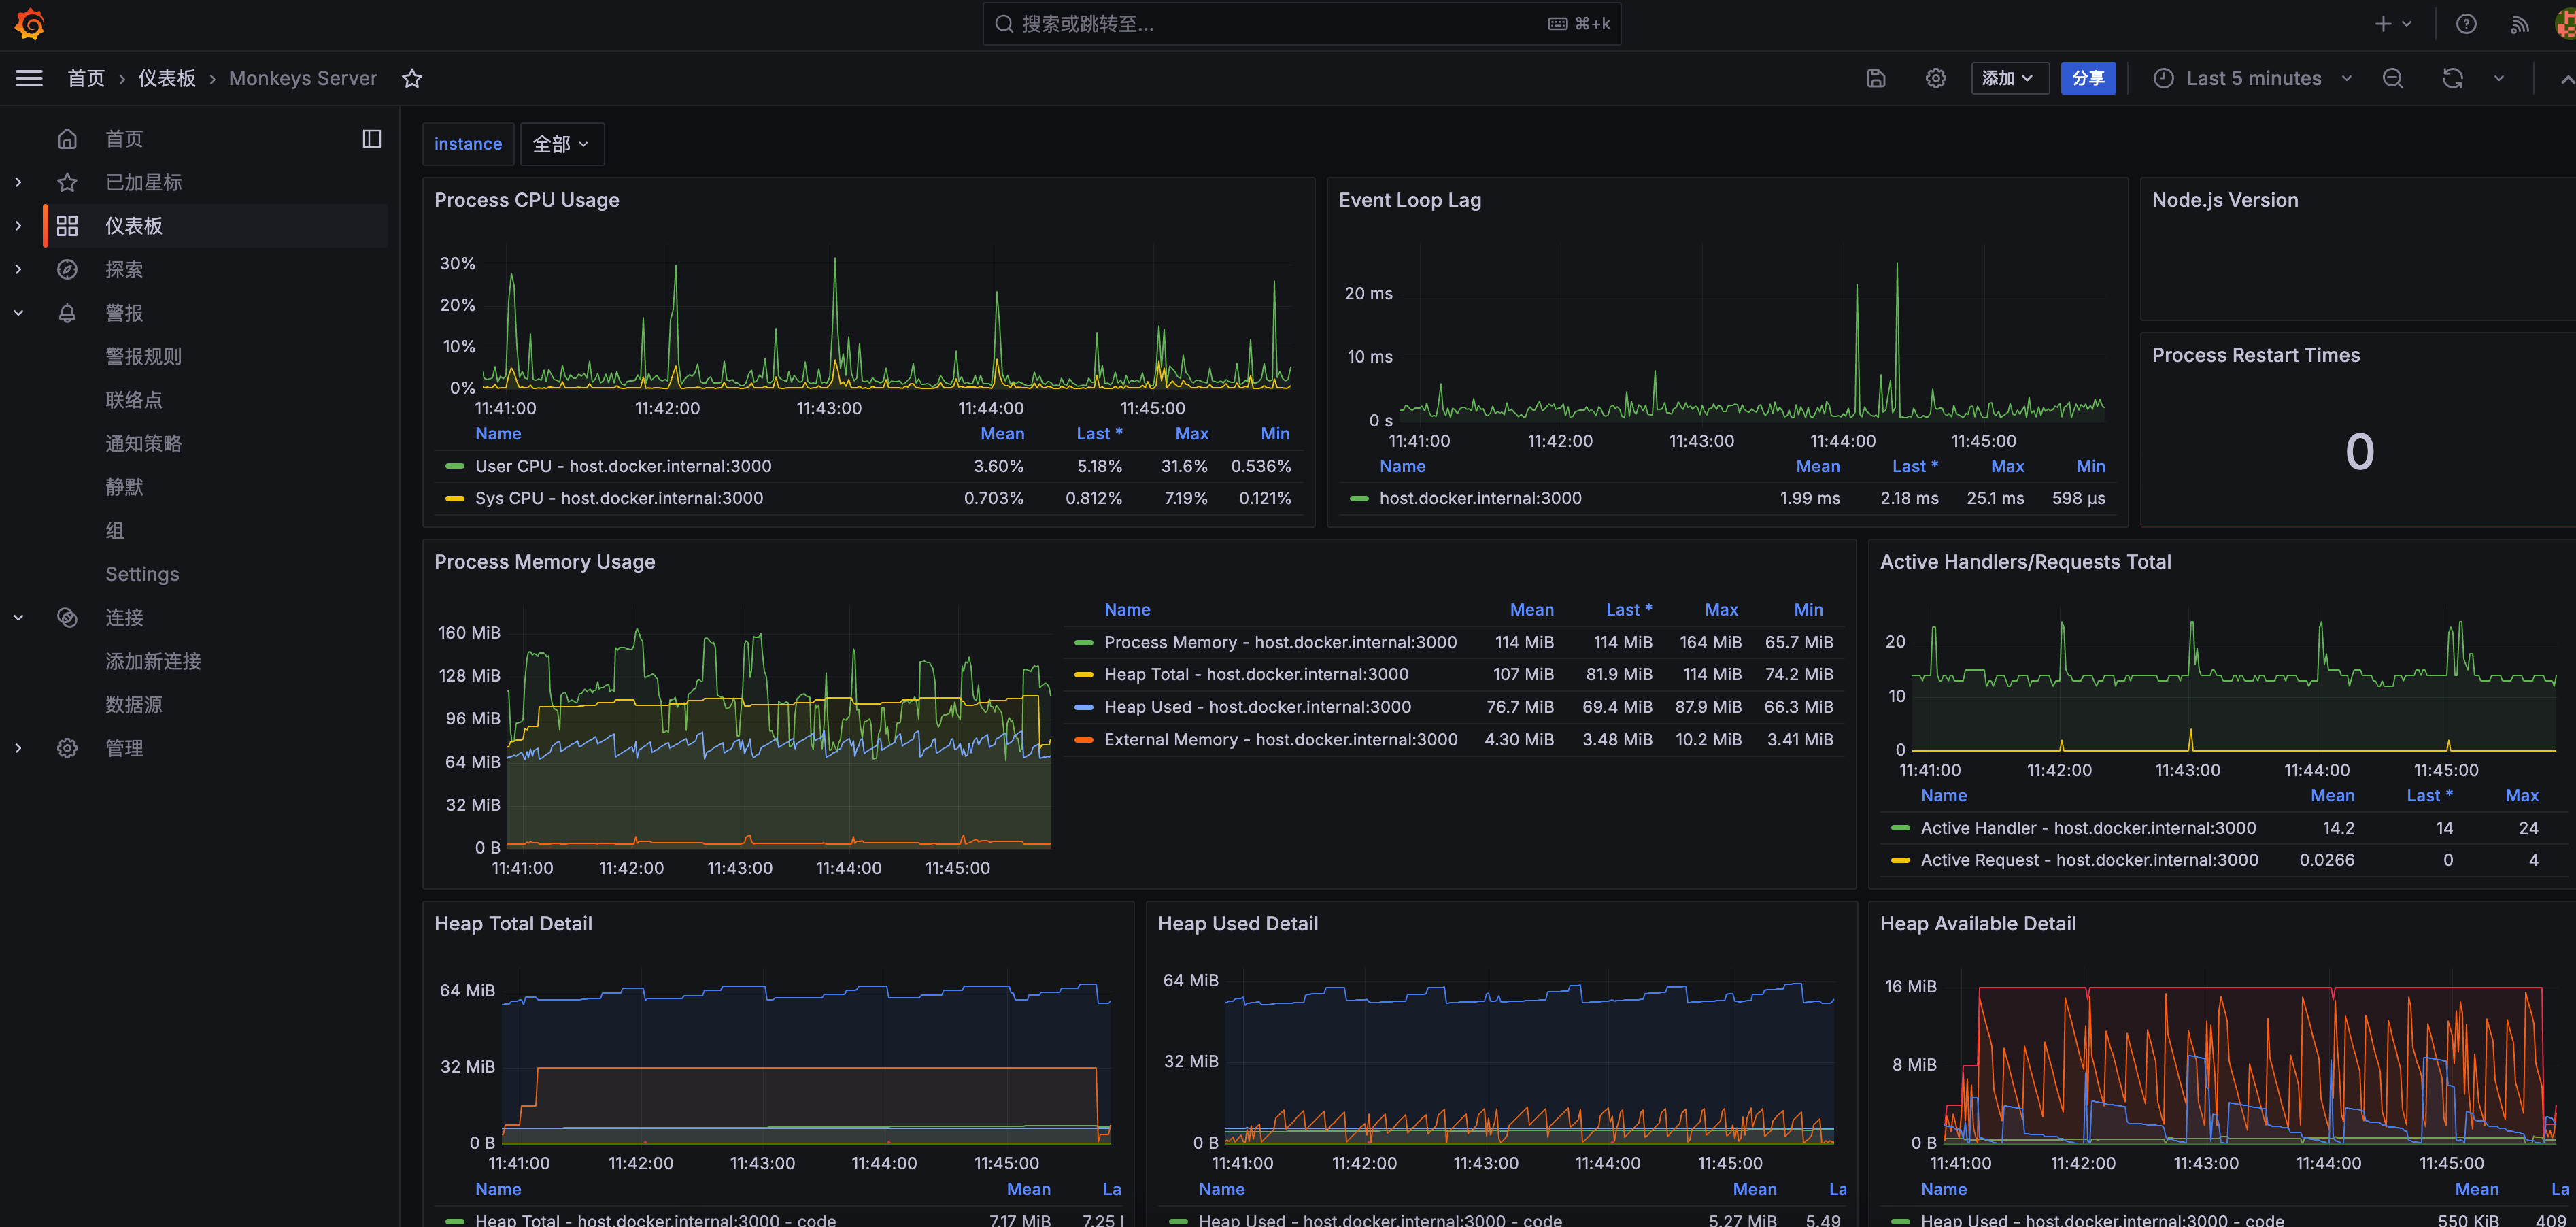
Monkeys Server Metrics
Monkeys Server is the core service of Monkeys, exposing metrics such as CPU, memory, and network of the Node.js application.
Demonstration
Prometheus Configuration
Add the following configuration to the Prometheus configuration file:
global.scrape_interval: Monitoring interval, recommended to be5s.scrape_configs[].metrics_path: The Prometheus metrics endpoint for Monkeys Server is/metrics.scrape_configs[].static_configs[].targets: The address and port of the Monkeys Server service, you may need to modify it according to the actual deployment.
global:  scrape_interval: 1s
scrape_configs:  - job_name: 'monkeys'    metrics_path: '/metrics'    static_configs:      - targets: ['monkeys-core-server:3000']
Grafana Configuration
Configure Prometheus Data Source
- In the Grafana console, go to Connections - Data Sources and add a Prometheus data source:
- Prometheus server URL: Enter the address and port of the Prometheus service.
- Scrape interval: Monitoring interval, recommended to be the shortest interval (1s).
- Click Save & Test to save and test if the Prometheus data source is configured correctly.
- Import the monitoring dashboard
- In the Grafana console, go to the Dashboard page, click the New button.
- Select the Import option.
- In the Grafana.com Dashboard URL or ID field, enter
11159(https://grafana.com/grafana/dashboards/11159-nodejs-application-dashboard/).
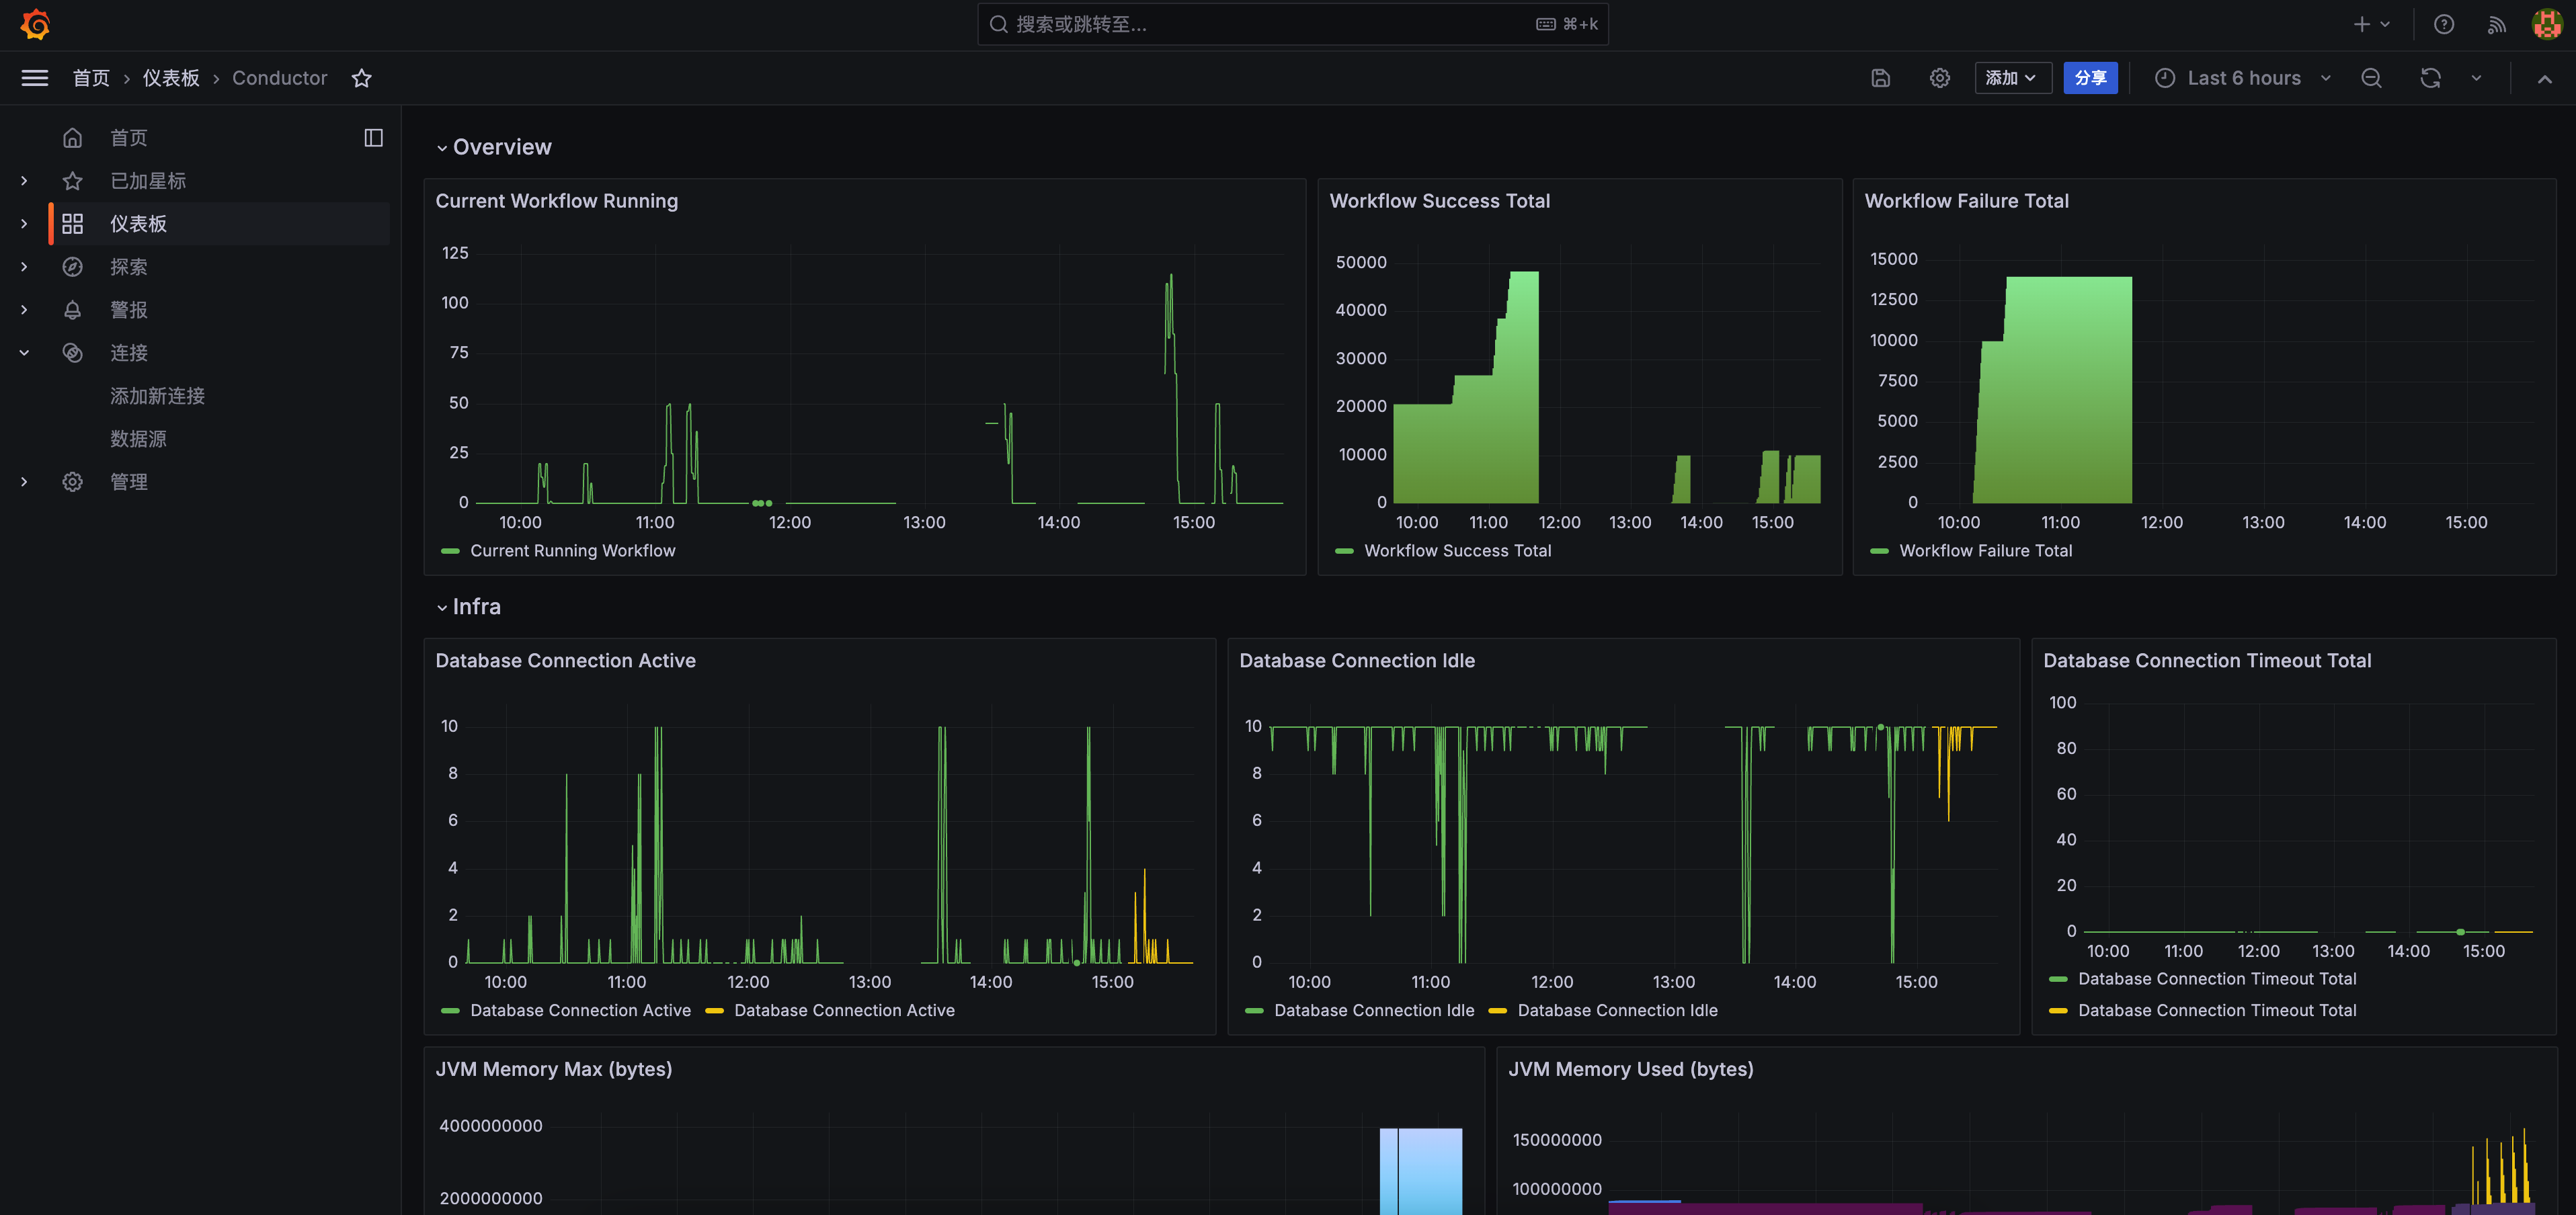
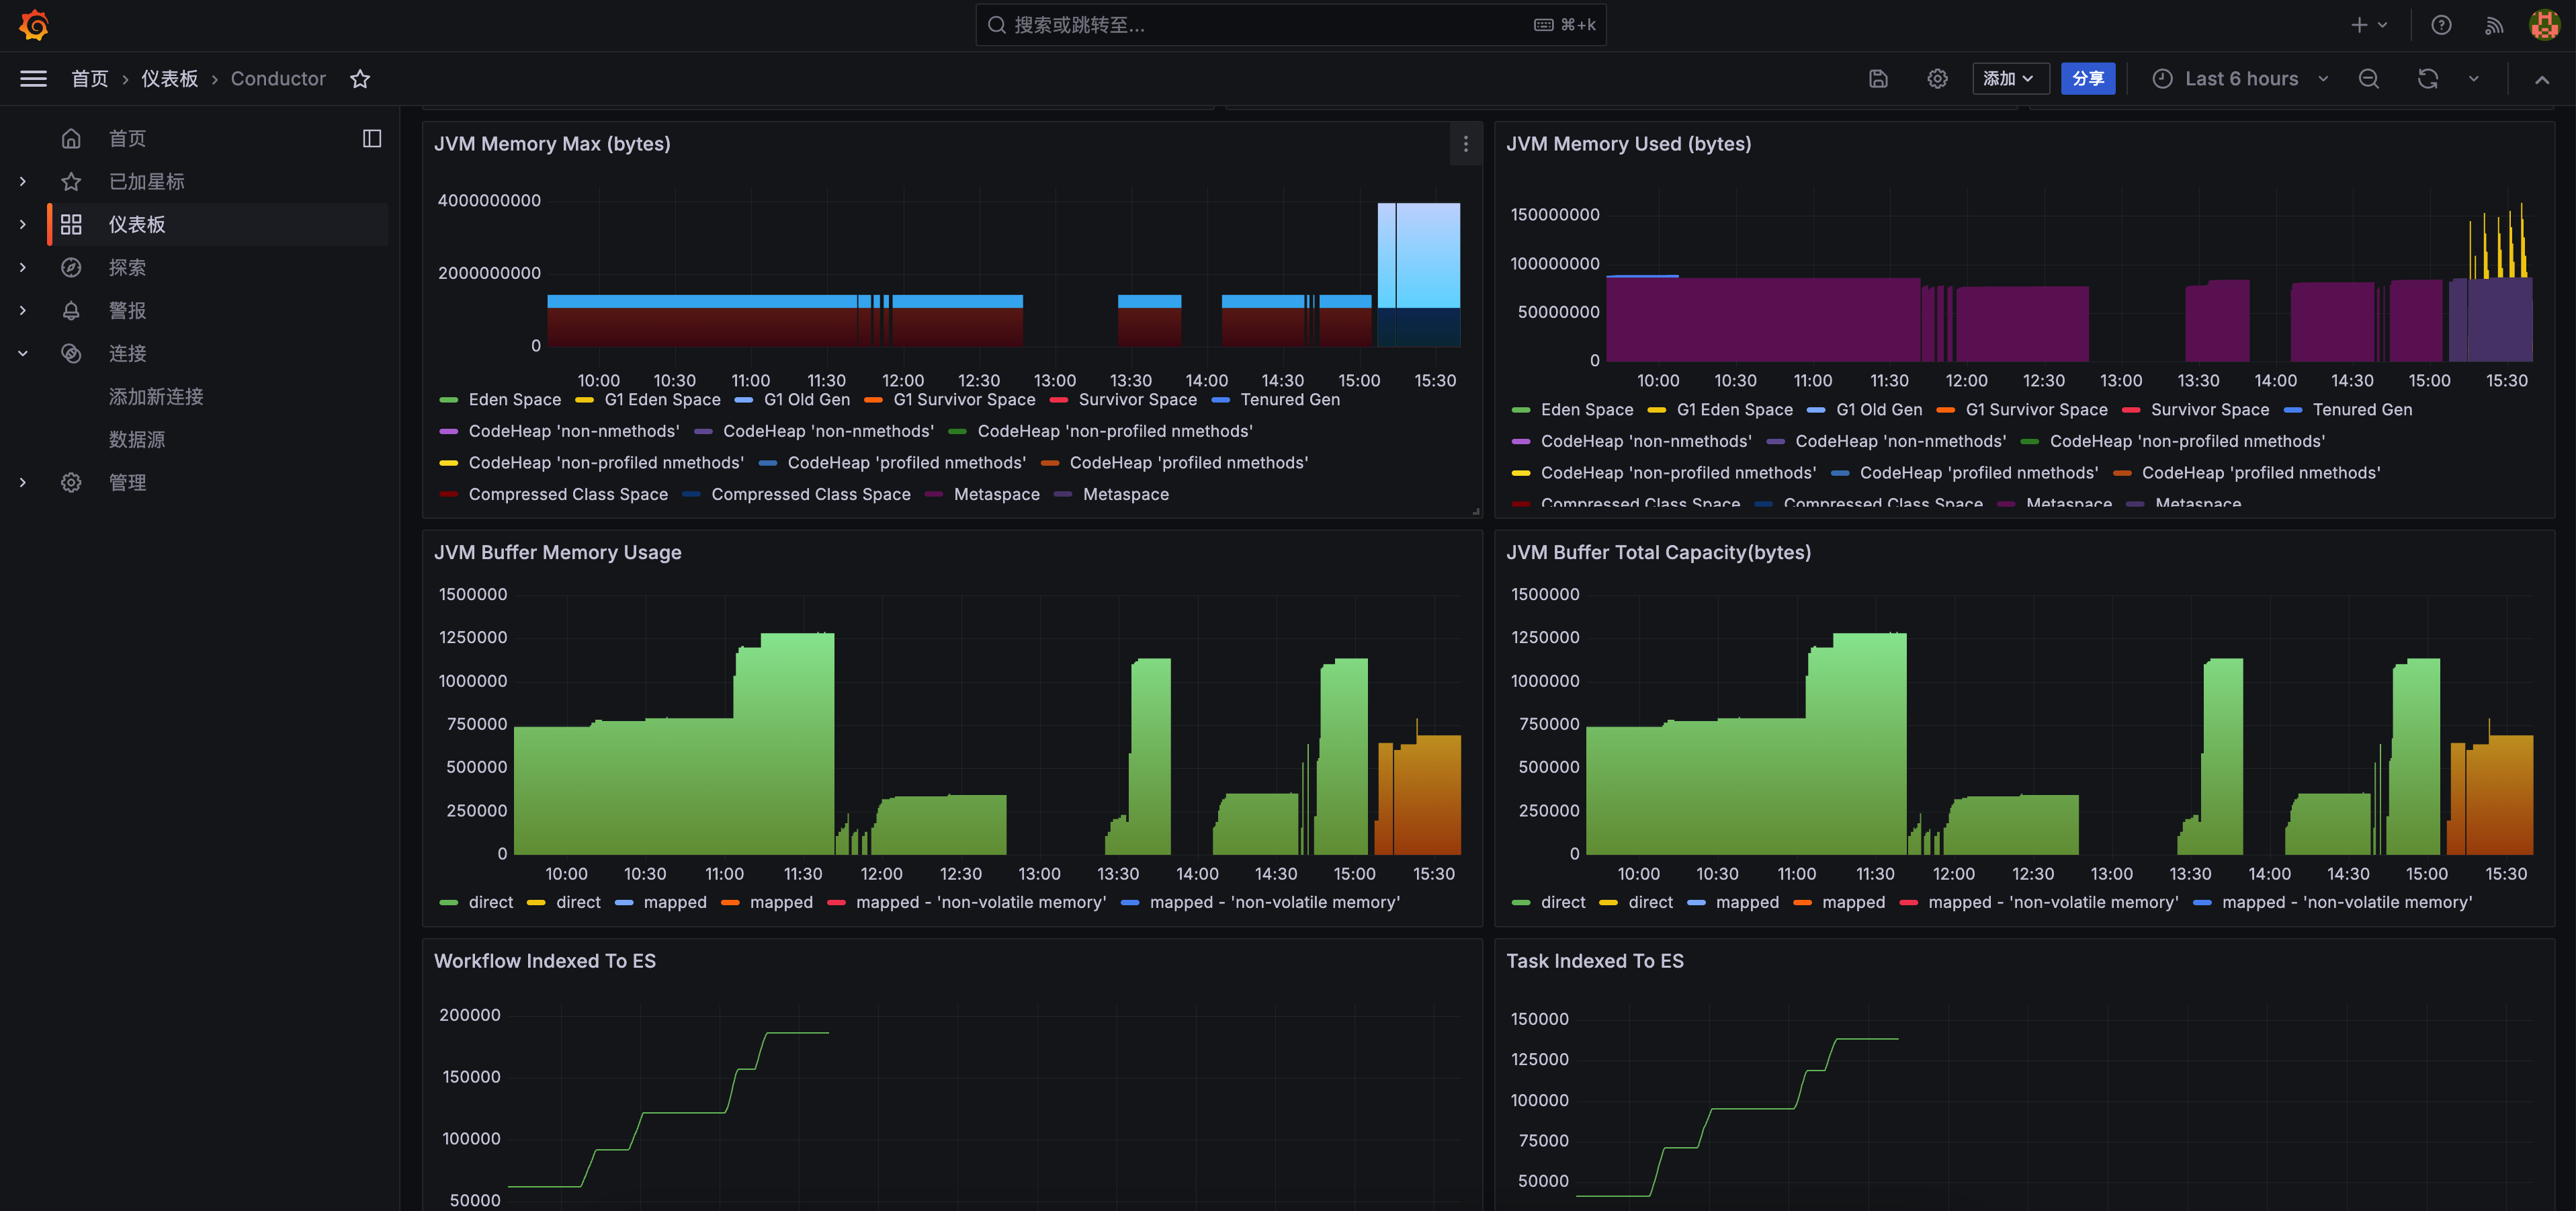
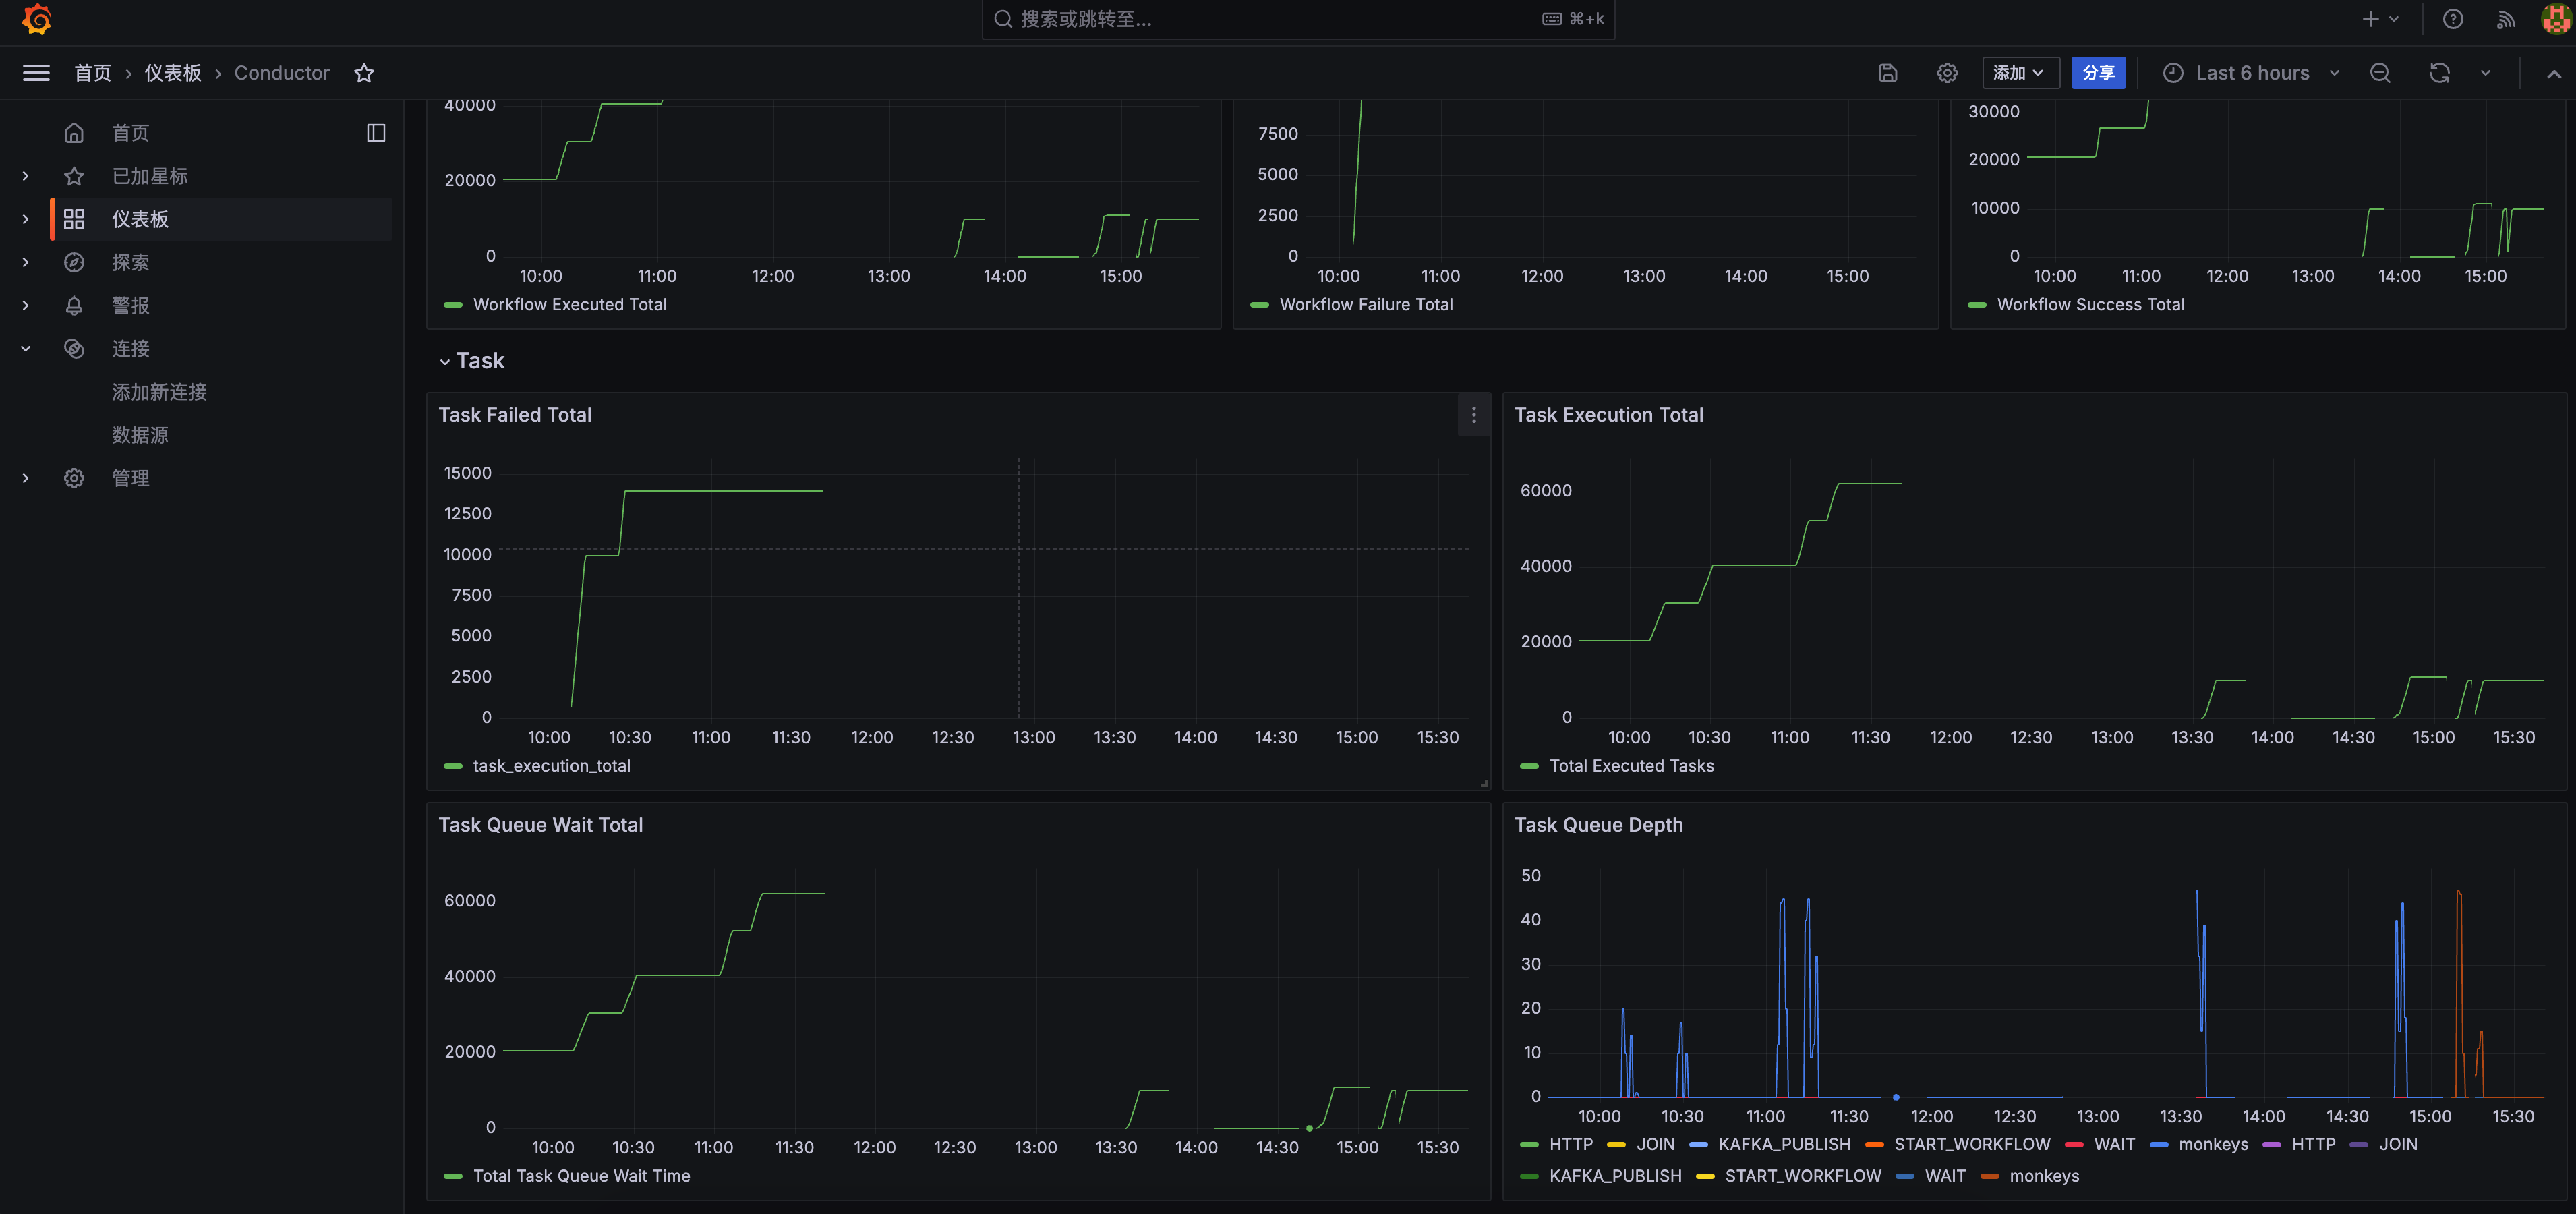
Conductor Metrics
Conductor is the workflow orchestration engine used by Monkeys, exposing metrics such as the number of currently running workflows, completed workflows, failed workflows, JVM memory, database connections, etc.
Demonstration
Prometheus Configuration
Add the following configuration to the Prometheus configuration file:
global.scrape_interval: Monitoring interval, recommended to be the shortest interval (1s), setting the interval too long may result in not being able to capture the actual number of currently running workflows in real-time.scrape_configs[].metrics_path: The Prometheus metrics endpoint for Conductor is/actuator/prometheus.scrape_configs[].static_configs[].targets: The address and port of the Conductor service, you may need to modify it according to the actual deployment.
global:  scrape_interval: 1s
scrape_configs:  - job_name: 'conductor'    metrics_path: '/actuator/prometheus'    static_configs:      - targets: ['monkeys-core-conductor:8080']
Grafana Configuration
Configure Prometheus Data Source
- In the Grafana console, go to Connections - Data Sources and add a Prometheus data source:
- Prometheus server URL: Enter the address and port of the Prometheus service.
- Scrape interval: Monitoring interval, recommended to be the shortest interval (1s).
- Click Save & Test to save and test if the Prometheus data source is configured correctly.
- Import the monitoring dashboard
- In the Grafana console, go to the Dashboard page, click the New button.
- Select the Import option.
- Import the following JSON model through the dashboard JSON model
Expand JSON Content
{ "annotations": { "list": [ { "builtIn": 1, "datasource": { "type": "grafana", "uid": "-- Grafana --" }, "enable": true, "hide": true, "iconColor": "rgba(0, 211, 255, 1)", "name": "Annotations & Alerts", "type": "dashboard" } ] }, "editable": true, "fiscalYearStartMonth": 0, "graphTooltip": 0, "id": 1, "links": [], "panels": [ { "collapsed": false, "gridPos": { "h": 1, "w": 24, "x": 0, "y": 0 }, "id": 21, "panels": [], "title": "Overview", "type": "row" }, { "datasource": { "type": "prometheus", "uid": "prometheus" }, "fieldConfig": { "defaults": { "color": { "mode": "palette-classic" }, "custom": { "axisBorderShow": false, "axisCenteredZero": false, "axisColorMode": "text", "axisLabel": "", "axisPlacement": "auto", "barAlignment": 0, "drawStyle": "line", "fillOpacity": 0, "gradientMode": "none", "hideFrom": { "legend": false, "tooltip": false, "viz": false }, "insertNulls": false, "lineInterpolation": "smooth", "lineWidth": 1, "pointSize": 5, "scaleDistribution": { "type": "linear" }, "showPoints": "auto", "spanNulls": false, "stacking": { "group": "A", "mode": "none" }, "thresholdsStyle": { "mode": "off" } }, "mappings": [], "thresholds": { "mode": "absolute", "steps": [ { "color": "green", "value": null }, { "color": "red", "value": 80 } ] } }, "overrides": [] }, "gridPos": { "h": 8, "w": 10, "x": 0, "y": 1 }, "id": 7, "options": { "legend": { "calcs": [], "displayMode": "list", "placement": "bottom", "showLegend": true }, "tooltip": { "mode": "single", "sort": "none" } }, "targets": [ { "datasource": { "type": "prometheus", "uid": "prometheus" }, "disableTextWrap": false, "editorMode": "builder", "exemplar": false, "expr": "sum by(__name__) (workflow_running)", "format": "time_series", "fullMetaSearch": false, "includeNullMetadata": true, "instant": false, "interval": "1s", "legendFormat": "Current Running Workflow", "range": true, "refId": "A", "useBackend": false } ], "title": "Current Workflow Running", "type": "timeseries" }, { "datasource": { "type": "prometheus", "uid": "prometheus" }, "fieldConfig": { "defaults": { "color": { "mode": "palette-classic" }, "custom": { "axisBorderShow": false, "axisCenteredZero": false, "axisColorMode": "text", "axisLabel": "", "axisPlacement": "auto", "barAlignment": 1, "drawStyle": "bars", "fillOpacity": 0, "gradientMode": "hue", "hideFrom": { "legend": false, "tooltip": false, "viz": false }, "insertNulls": false, "lineInterpolation": "linear", "lineWidth": 1, "pointSize": 5, "scaleDistribution": { "type": "linear" }, "showPoints": "auto", "spanNulls": false, "stacking": { "group": "A", "mode": "none" }, "thresholdsStyle": { "mode": "off" } }, "mappings": [], "thresholds": { "mode": "absolute", "steps": [ { "color": "green", "value": null }, { "color": "red", "value": 80 } ] } }, "overrides": [] }, "gridPos": { "h": 8, "w": 6, "x": 10, "y": 1 }, "id": 26, "options": { "legend": { "calcs": [], "displayMode": "list", "placement": "bottom", "showLegend": true }, "tooltip": { "mode": "single", "sort": "none" } }, "targets": [ { "datasource": { "type": "prometheus", "uid": "prometheus" }, "disableTextWrap": false, "editorMode": "builder", "expr": "sum by(__name__) (workflow_execution_total)", "format": "time_series", "fullMetaSearch": false, "includeNullMetadata": true, "instant": false, "legendFormat": "Workflow Success Total", "range": true, "refId": "A", "useBackend": false } ], "title": "Workflow Success Total", "type": "timeseries" }, { "datasource": { "type": "prometheus", "uid": "prometheus" }, "fieldConfig": { "defaults": { "color": { "mode": "palette-classic" }, "custom": { "axisBorderShow": false, "axisCenteredZero": false, "axisColorMode": "text", "axisLabel": "", "axisPlacement": "auto", "barAlignment": 1, "drawStyle": "bars", "fillOpacity": 0, "gradientMode": "hue", "hideFrom": { "legend": false, "tooltip": false, "viz": false }, "insertNulls": false, "lineInterpolation": "linear", "lineWidth": 1, "pointSize": 5, "scaleDistribution": { "type": "linear" }, "showPoints": "auto", "spanNulls": false, "stacking": { "group": "A", "mode": "none" }, "thresholdsStyle": { "mode": "off" } }, "mappings": [], "thresholds": { "mode": "absolute", "steps": [ { "color": "green", "value": null }, { "color": "red", "value": 80 } ] } }, "overrides": [] }, "gridPos": { "h": 8, "w": 8, "x": 16, "y": 1 }, "id": 25, "options": { "legend": { "calcs": [], "displayMode": "list", "placement": "bottom", "showLegend": true }, "tooltip": { "mode": "single", "sort": "none" } }, "targets": [ { "datasource": { "type": "prometheus", "uid": "prometheus" }, "disableTextWrap": false, "editorMode": "builder", "expr": "workflow_failure_total", "fullMetaSearch": false, "includeNullMetadata": true, "instant": false, "legendFormat": "Workflow Failure Total", "range": true, "refId": "A", "useBackend": false } ], "title": "Workflow Failure Total", "type": "timeseries" }, { "collapsed": false, "gridPos": { "h": 1, "w": 24, "x": 0, "y": 9 }, "id": 15, "panels": [], "title": "Infra", "type": "row" }, { "datasource": { "type": "prometheus", "uid": "prometheus" }, "fieldConfig": { "defaults": { "color": { "mode": "palette-classic" }, "custom": { "axisBorderShow": false, "axisCenteredZero": false, "axisColorMode": "text", "axisLabel": "", "axisPlacement": "auto", "barAlignment": 0, "drawStyle": "line", "fillOpacity": 0, "gradientMode": "none", "hideFrom": { "legend": false, "tooltip": false, "viz": false }, "insertNulls": false, "lineInterpolation": "linear", "lineWidth": 1, "pointSize": 5, "scaleDistribution": { "type": "linear" }, "showPoints": "auto", "spanNulls": false, "stacking": { "group": "A", "mode": "none" }, "thresholdsStyle": { "mode": "off" } }, "mappings": [], "thresholds": { "mode": "absolute", "steps": [ { "color": "green", "value": null }, { "color": "red", "value": 80 } ] } }, "overrides": [] }, "gridPos": { "h": 8, "w": 9, "x": 0, "y": 10 }, "id": 16, "options": { "legend": { "calcs": [], "displayMode": "list", "placement": "bottom", "showLegend": true }, "tooltip": { "mode": "single", "sort": "none" } }, "targets": [ { "datasource": { "type": "prometheus", "uid": "prometheus" }, "disableTextWrap": false, "editorMode": "builder", "exemplar": false, "expr": "hikaricp_connections_active", "fullMetaSearch": false, "includeNullMetadata": true, "instant": false, "legendFormat": "Database Connection Active", "range": true, "refId": "A", "useBackend": false } ], "title": "Database Connection Active", "type": "timeseries" }, { "datasource": { "type": "prometheus", "uid": "prometheus" }, "fieldConfig": { "defaults": { "color": { "mode": "palette-classic" }, "custom": { "axisBorderShow": false, "axisCenteredZero": false, "axisColorMode": "text", "axisLabel": "", "axisPlacement": "auto", "barAlignment": 0, "drawStyle": "line", "fillOpacity": 0, "gradientMode": "none", "hideFrom": { "legend": false, "tooltip": false, "viz": false }, "insertNulls": false, "lineInterpolation": "linear", "lineWidth": 1, "pointSize": 5, "scaleDistribution": { "type": "linear" }, "showPoints": "auto", "spanNulls": false, "stacking": { "group": "A", "mode": "none" }, "thresholdsStyle": { "mode": "off" } }, "mappings": [], "thresholds": { "mode": "absolute", "steps": [ { "color": "green", "value": null }, { "color": "red", "value": 80 } ] } }, "overrides": [] }, "gridPos": { "h": 8, "w": 9, "x": 9, "y": 10 }, "id": 18, "options": { "legend": { "calcs": [], "displayMode": "list", "placement": "bottom", "showLegend": true }, "tooltip": { "mode": "single", "sort": "none" } }, "targets": [ { "datasource": { "type": "prometheus", "uid": "prometheus" }, "disableTextWrap": false, "editorMode": "builder", "expr": "hikaricp_connections_idle", "fullMetaSearch": false, "includeNullMetadata": true, "instant": false, "legendFormat": "Database Connection Idle", "range": true, "refId": "A", "useBackend": false } ], "title": "Database Connection Idle", "type": "timeseries" }, { "datasource": { "type": "prometheus", "uid": "prometheus" }, "fieldConfig": { "defaults": { "color": { "mode": "palette-classic" }, "custom": { "axisBorderShow": false, "axisCenteredZero": false, "axisColorMode": "text", "axisLabel": "", "axisPlacement": "auto", "barAlignment": 0, "drawStyle": "line", "fillOpacity": 0, "gradientMode": "none", "hideFrom": { "legend": false, "tooltip": false, "viz": false }, "insertNulls": false, "lineInterpolation": "linear", "lineWidth": 1, "pointSize": 5, "scaleDistribution": { "type": "linear" }, "showPoints": "auto", "spanNulls": false, "stacking": { "group": "A", "mode": "none" }, "thresholdsStyle": { "mode": "off" } }, "mappings": [], "thresholds": { "mode": "absolute", "steps": [ { "color": "green", "value": null }, { "color": "red", "value": 80 } ] } }, "overrides": [] }, "gridPos": { "h": 8, "w": 6, "x": 18, "y": 10 }, "id": 19, "options": { "legend": { "calcs": [], "displayMode": "list", "placement": "bottom", "showLegend": true }, "tooltip": { "mode": "single", "sort": "none" } }, "targets": [ { "datasource": { "type": "prometheus", "uid": "prometheus" }, "disableTextWrap": false, "editorMode": "builder", "expr": "hikaricp_connections_timeout_total", "fullMetaSearch": false, "includeNullMetadata": true, "instant": false, "legendFormat": "Database Connection Timeout Total", "range": true, "refId": "A", "useBackend": false } ], "title": "Database Connection Timeout Total", "type": "timeseries" }, { "datasource": { "type": "prometheus", "uid": "prometheus" }, "fieldConfig": { "defaults": { "color": { "mode": "palette-classic" }, "custom": { "axisBorderShow": false, "axisCenteredZero": false, "axisColorMode": "text", "axisLabel": "", "axisPlacement": "auto", "barAlignment": 0, "drawStyle": "bars", "fillOpacity": 0, "gradientMode": "hue", "hideFrom": { "legend": false, "tooltip": false, "viz": false }, "insertNulls": false, "lineInterpolation": "linear", "lineWidth": 1, "pointSize": 5, "scaleDistribution": { "type": "linear" }, "showPoints": "auto", "spanNulls": false, "stacking": { "group": "A", "mode": "none" }, "thresholdsStyle": { "mode": "off" } }, "mappings": [], "thresholds": { "mode": "absolute", "steps": [ { "color": "green", "value": null }, { "color": "red", "value": 80 } ] } }, "overrides": [] }, "gridPos": { "h": 8, "w": 12, "x": 0, "y": 18 }, "id": 29, "options": { "legend": { "calcs": [], "displayMode": "list", "placement": "bottom", "showLegend": true }, "tooltip": { "mode": "single", "sort": "none" } }, "targets": [ { "datasource": { "type": "prometheus", "uid": "prometheus" }, "disableTextWrap": false, "editorMode": "builder", "expr": "jvm_memory_max_bytes", "fullMetaSearch": false, "includeNullMetadata": true, "instant": false, "legendFormat": "{{id}}", "range": true, "refId": "A", "useBackend": false } ], "title": "JVM Memory Max (bytes)", "type": "timeseries" }, { "datasource": { "type": "prometheus", "uid": "prometheus" }, "fieldConfig": { "defaults": { "color": { "mode": "palette-classic" }, "custom": { "axisBorderShow": false, "axisCenteredZero": false, "axisColorMode": "text", "axisLabel": "", "axisPlacement": "auto", "barAlignment": 0, "drawStyle": "bars", "fillOpacity": 0, "gradientMode": "none", "hideFrom": { "legend": false, "tooltip": false, "viz": false }, "insertNulls": false, "lineInterpolation": "linear", "lineWidth": 1, "pointSize": 5, "scaleDistribution": { "type": "linear" }, "showPoints": "auto", "spanNulls": false, "stacking": { "group": "A", "mode": "none" }, "thresholdsStyle": { "mode": "off" } }, "mappings": [], "thresholds": { "mode": "absolute", "steps": [ { "color": "green", "value": null }, { "color": "red", "value": 80 } ] } }, "overrides": [] }, "gridPos": { "h": 8, "w": 12, "x": 12, "y": 18 }, "id": 30, "options": { "legend": { "calcs": [], "displayMode": "list", "placement": "bottom", "showLegend": true }, "tooltip": { "mode": "single", "sort": "none" } }, "targets": [ { "datasource": { "type": "prometheus", "uid": "prometheus" }, "disableTextWrap": false, "editorMode": "builder", "expr": "jvm_memory_used_bytes", "fullMetaSearch": false, "includeNullMetadata": true, "instant": false, "legendFormat": "{{id}}", "range": true, "refId": "A", "useBackend": false } ], "title": "JVM Memory Used (bytes)", "type": "timeseries" }, { "datasource": { "type": "prometheus", "uid": "prometheus" }, "fieldConfig": { "defaults": { "color": { "mode": "palette-classic" }, "custom": { "axisBorderShow": false, "axisCenteredZero": false, "axisColorMode": "text", "axisLabel": "", "axisPlacement": "auto", "barAlignment": 0, "drawStyle": "bars", "fillOpacity": 0, "gradientMode": "hue", "hideFrom": { "legend": false, "tooltip": false, "viz": false }, "insertNulls": false, "lineInterpolation": "linear", "lineWidth": 1, "pointSize": 5, "scaleDistribution": { "type": "linear" }, "showPoints": "auto", "spanNulls": false, "stacking": { "group": "A", "mode": "none" }, "thresholdsStyle": { "mode": "off" } }, "mappings": [], "thresholds": { "mode": "absolute", "steps": [ { "color": "green", "value": null }, { "color": "red", "value": 80 } ] } }, "overrides": [] }, "gridPos": { "h": 8, "w": 12, "x": 0, "y": 26 }, "id": 27, "options": { "legend": { "calcs": [], "displayMode": "list", "placement": "bottom", "showLegend": true }, "tooltip": { "mode": "single", "sort": "none" } }, "targets": [ { "datasource": { "type": "prometheus", "uid": "prometheus" }, "disableTextWrap": false, "editorMode": "builder", "expr": "jvm_buffer_memory_used_bytes", "fullMetaSearch": false, "includeNullMetadata": true, "instant": false, "legendFormat": "{{id}}", "range": true, "refId": "A", "useBackend": false } ], "title": "JVM Buffer Memory Usage", "type": "timeseries" }, { "datasource": { "type": "prometheus", "uid": "prometheus" }, "fieldConfig": { "defaults": { "color": { "mode": "palette-classic" }, "custom": { "axisBorderShow": false, "axisCenteredZero": false, "axisColorMode": "text", "axisLabel": "", "axisPlacement": "auto", "barAlignment": 0, "drawStyle": "bars", "fillOpacity": 0, "gradientMode": "hue", "hideFrom": { "legend": false, "tooltip": false, "viz": false }, "insertNulls": false, "lineInterpolation": "linear", "lineWidth": 1, "pointSize": 5, "scaleDistribution": { "type": "linear" }, "showPoints": "auto", "spanNulls": false, "stacking": { "group": "A", "mode": "none" }, "thresholdsStyle": { "mode": "off" } }, "mappings": [], "thresholds": { "mode": "absolute", "steps": [ { "color": "green", "value": null }, { "color": "red", "value": 80 } ] } }, "overrides": [] }, "gridPos": { "h": 8, "w": 12, "x": 12, "y": 26 }, "id": 28, "options": { "legend": { "calcs": [], "displayMode": "list", "placement": "bottom", "showLegend": true }, "tooltip": { "mode": "single", "sort": "none" } }, "targets": [ { "datasource": { "type": "prometheus", "uid": "prometheus" }, "disableTextWrap": false, "editorMode": "builder", "expr": "jvm_buffer_total_capacity_bytes", "fullMetaSearch": false, "includeNullMetadata": true, "instant": false, "legendFormat": "{{id}}", "range": true, "refId": "A", "useBackend": false } ], "title": "JVM Buffer Total Capacity(bytes)", "type": "timeseries" }, { "datasource": { "type": "prometheus", "uid": "prometheus" }, "fieldConfig": { "defaults": { "color": { "mode": "palette-classic" }, "custom": { "axisBorderShow": false, "axisCenteredZero": false, "axisColorMode": "text", "axisLabel": "", "axisPlacement": "auto", "barAlignment": 0, "drawStyle": "line", "fillOpacity": 0, "gradientMode": "none", "hideFrom": { "legend": false, "tooltip": false, "viz": false }, "insertNulls": false, "lineInterpolation": "linear", "lineWidth": 1, "pointSize": 5, "scaleDistribution": { "type": "linear" }, "showPoints": "auto", "spanNulls": false, "stacking": { "group": "A", "mode": "none" }, "thresholdsStyle": { "mode": "off" } }, "mappings": [], "thresholds": { "mode": "absolute", "steps": [ { "color": "green", "value": null }, { "color": "red", "value": 80 } ] } }, "overrides": [] }, "gridPos": { "h": 8, "w": 12, "x": 0, "y": 34 }, "id": 22, "options": { "legend": { "calcs": [], "displayMode": "list", "placement": "bottom", "showLegend": true }, "tooltip": { "mode": "single", "sort": "none" } }, "targets": [ { "datasource": { "type": "prometheus", "uid": "prometheus" }, "disableTextWrap": false, "editorMode": "builder", "expr": "sum by(__name__) (index_workflow_total)", "fullMetaSearch": false, "includeNullMetadata": true, "instant": false, "legendFormat": "Workflow Indexed To ES", "range": true, "refId": "A", "useBackend": false } ], "title": "Workflow Indexed To ES", "type": "timeseries" }, { "datasource": { "type": "prometheus", "uid": "prometheus" }, "fieldConfig": { "defaults": { "color": { "mode": "palette-classic" }, "custom": { "axisBorderShow": false, "axisCenteredZero": false, "axisColorMode": "text", "axisLabel": "", "axisPlacement": "auto", "barAlignment": 0, "drawStyle": "line", "fillOpacity": 0, "gradientMode": "none", "hideFrom": { "legend": false, "tooltip": false, "viz": false }, "insertNulls": false, "lineInterpolation": "linear", "lineWidth": 1, "pointSize": 5, "scaleDistribution": { "type": "linear" }, "showPoints": "auto", "spanNulls": false, "stacking": { "group": "A", "mode": "none" }, "thresholdsStyle": { "mode": "off" } }, "mappings": [], "thresholds": { "mode": "absolute", "steps": [ { "color": "green", "value": null }, { "color": "red", "value": 80 } ] } }, "overrides": [] }, "gridPos": { "h": 8, "w": 12, "x": 12, "y": 34 }, "id": 23, "options": { "legend": { "calcs": [], "displayMode": "list", "placement": "bottom", "showLegend": true }, "tooltip": { "mode": "single", "sort": "none" } }, "targets": [ { "datasource": { "type": "prometheus", "uid": "prometheus" }, "disableTextWrap": false, "editorMode": "builder", "expr": "sum by(__name__) (index_task_total)", "fullMetaSearch": false, "includeNullMetadata": true, "instant": false, "legendFormat": "Task Indexed To ES", "range": true, "refId": "A", "useBackend": false } ], "title": "Task Indexed To ES", "type": "timeseries" }, { "collapsed": true, "gridPos": { "h": 1, "w": 24, "x": 0, "y": 42 }, "id": 32, "panels": [ { "datasource": { "type": "prometheus", "uid": "prometheus" }, "fieldConfig": { "defaults": { "color": { "mode": "palette-classic" }, "custom": { "axisBorderShow": false, "axisCenteredZero": false, "axisColorMode": "text", "axisLabel": "", "axisPlacement": "auto", "barAlignment": 0, "drawStyle": "line", "fillOpacity": 0, "gradientMode": "none", "hideFrom": { "legend": false, "tooltip": false, "viz": false }, "insertNulls": false, "lineInterpolation": "linear", "lineWidth": 1, "pointSize": 5, "scaleDistribution": { "type": "linear" }, "showPoints": "auto", "spanNulls": false, "stacking": { "group": "A", "mode": "none" }, "thresholdsStyle": { "mode": "off" } }, "mappings": [], "thresholds": { "mode": "absolute", "steps": [ { "color": "green" }, { "color": "red", "value": 80 } ] } }, "overrides": [] }, "gridPos": { "h": 8, "w": 12, "x": 0, "y": 3 }, "id": 33, "options": { "legend": { "calcs": [], "displayMode": "list", "placement": "bottom", "showLegend": true }, "tooltip": { "mode": "single", "sort": "none" } }, "targets": [ { "datasource": { "type": "prometheus", "uid": "prometheus" }, "disableTextWrap": false, "editorMode": "builder", "expr": "rate(http_server_requests_seconds_sum[$__rate_interval])", "fullMetaSearch": false, "includeNullMetadata": false, "instant": false, "legendFormat": "{{method}} - {{uri}}", "range": true, "refId": "A", "useBackend": false } ], "title": "Requests Time (Seconds)", "type": "timeseries" }, { "datasource": { "type": "prometheus", "uid": "prometheus" }, "fieldConfig": { "defaults": { "color": { "mode": "palette-classic" }, "custom": { "axisBorderShow": false, "axisCenteredZero": false, "axisColorMode": "text", "axisLabel": "", "axisPlacement": "auto", "barAlignment": 0, "drawStyle": "line", "fillOpacity": 0, "gradientMode": "none", "hideFrom": { "legend": false, "tooltip": false, "viz": false }, "insertNulls": false, "lineInterpolation": "linear", "lineWidth": 1, "pointSize": 5, "scaleDistribution": { "type": "linear" }, "showPoints": "auto", "spanNulls": false, "stacking": { "group": "A", "mode": "none" }, "thresholdsStyle": { "mode": "off" } }, "mappings": [], "thresholds": { "mode": "absolute", "steps": [ { "color": "green" }, { "color": "red", "value": 80 } ] } }, "overrides": [] }, "gridPos": { "h": 8, "w": 12, "x": 12, "y": 3 }, "id": 31, "options": { "legend": { "calcs": [], "displayMode": "list", "placement": "bottom", "showLegend": true }, "tooltip": { "mode": "single", "sort": "none" } }, "targets": [ { "datasource": { "type": "prometheus", "uid": "prometheus" }, "disableTextWrap": false, "editorMode": "builder", "expr": "http_server_requests_seconds_count", "fullMetaSearch": false, "includeNullMetadata": true, "instant": false, "legendFormat": "{{method}} - {{uri}}", "range": true, "refId": "A", "useBackend": false } ], "title": "Requests Total", "type": "timeseries" } ], "title": "Server", "type": "row" }, { "collapsed": false, "gridPos": { "h": 1, "w": 24, "x": 0, "y": 43 }, "id": 12, "panels": [], "title": "Workflow", "type": "row" }, { "datasource": { "type": "prometheus", "uid": "prometheus" }, "fieldConfig": { "defaults": { "color": { "mode": "palette-classic" }, "custom": { "axisBorderShow": false, "axisCenteredZero": false, "axisColorMode": "text", "axisLabel": "", "axisPlacement": "auto", "barAlignment": 0, "drawStyle": "line", "fillOpacity": 0, "gradientMode": "none", "hideFrom": { "legend": false, "tooltip": false, "viz": false }, "insertNulls": false, "lineInterpolation": "linear", "lineWidth": 1, "pointSize": 5, "scaleDistribution": { "type": "linear" }, "showPoints": "auto", "spanNulls": false, "stacking": { "group": "A", "mode": "none" }, "thresholdsStyle": { "mode": "off" } }, "mappings": [], "thresholds": { "mode": "absolute", "steps": [ { "color": "green", "value": null }, { "color": "red", "value": 80 } ] } }, "overrides": [] }, "gridPos": { "h": 8, "w": 9, "x": 0, "y": 44 }, "id": 9, "options": { "legend": { "calcs": [], "displayMode": "list", "placement": "bottom", "showLegend": true }, "tooltip": { "mode": "single", "sort": "none" } }, "targets": [ { "datasource": { "type": "prometheus", "uid": "prometheus" }, "disableTextWrap": false, "editorMode": "builder", "expr": "sum by(__name__) (workflow_decision_total)", "fullMetaSearch": false, "includeNullMetadata": true, "instant": false, "legendFormat": "Workflow Executed Total", "range": true, "refId": "A", "useBackend": false } ], "title": "Workflow Executed Total", "type": "timeseries" }, { "datasource": { "type": "prometheus", "uid": "prometheus" }, "fieldConfig": { "defaults": { "color": { "mode": "palette-classic" }, "custom": { "axisBorderShow": false, "axisCenteredZero": false, "axisColorMode": "text", "axisLabel": "", "axisPlacement": "auto", "barAlignment": 0, "drawStyle": "line", "fillOpacity": 0, "gradientMode": "none", "hideFrom": { "legend": false, "tooltip": false, "viz": false }, "insertNulls": false, "lineInterpolation": "linear", "lineWidth": 1, "pointSize": 5, "scaleDistribution": { "type": "linear" }, "showPoints": "auto", "spanNulls": false, "stacking": { "group": "A", "mode": "none" }, "thresholdsStyle": { "mode": "off" } }, "mappings": [], "thresholds": { "mode": "absolute", "steps": [ { "color": "green", "value": null }, { "color": "red", "value": 80 } ] } }, "overrides": [] }, "gridPos": { "h": 8, "w": 8, "x": 9, "y": 44 }, "id": 14, "options": { "legend": { "calcs": [], "displayMode": "list", "placement": "bottom", "showLegend": true }, "tooltip": { "mode": "single", "sort": "none" } }, "targets": [ { "datasource": { "type": "prometheus", "uid": "prometheus" }, "disableTextWrap": false, "editorMode": "builder", "expr": "workflow_failure_total", "fullMetaSearch": false, "includeNullMetadata": true, "instant": false, "legendFormat": "Workflow Failure Total", "range": true, "refId": "A", "useBackend": false } ], "title": "Workflow Failure Total", "type": "timeseries" }, { "datasource": { "type": "prometheus", "uid": "prometheus" }, "fieldConfig": { "defaults": { "color": { "mode": "palette-classic" }, "custom": { "axisBorderShow": false, "axisCenteredZero": false, "axisColorMode": "text", "axisLabel": "", "axisPlacement": "auto", "barAlignment": 0, "drawStyle": "line", "fillOpacity": 0, "gradientMode": "none", "hideFrom": { "legend": false, "tooltip": false, "viz": false }, "insertNulls": false, "lineInterpolation": "linear", "lineWidth": 1, "pointSize": 5, "scaleDistribution": { "type": "linear" }, "showPoints": "auto", "spanNulls": false, "stacking": { "group": "A", "mode": "none" }, "thresholdsStyle": { "mode": "off" } }, "mappings": [], "thresholds": { "mode": "absolute", "steps": [ { "color": "green", "value": null }, { "color": "red", "value": 80 } ] } }, "overrides": [] }, "gridPos": { "h": 8, "w": 7, "x": 17, "y": 44 }, "id": 13, "options": { "legend": { "calcs": [], "displayMode": "list", "placement": "bottom", "showLegend": true }, "tooltip": { "mode": "single", "sort": "none" } }, "targets": [ { "datasource": { "type": "prometheus", "uid": "prometheus" }, "disableTextWrap": false, "editorMode": "builder", "expr": "sum by(__name__) (workflow_execution_total)", "format": "time_series", "fullMetaSearch": false, "includeNullMetadata": true, "instant": false, "legendFormat": "Workflow Success Total", "range": true, "refId": "A", "useBackend": false } ], "title": "Workflow Success Total", "type": "timeseries" }, { "collapsed": false, "gridPos": { "h": 1, "w": 24, "x": 0, "y": 52 }, "id": 11, "panels": [], "title": "Task", "type": "row" }, { "datasource": { "type": "prometheus", "uid": "prometheus" }, "fieldConfig": { "defaults": { "color": { "mode": "palette-classic" }, "custom": { "axisBorderShow": false, "axisCenteredZero": false, "axisColorMode": "text", "axisLabel": "", "axisPlacement": "auto", "barAlignment": 0, "drawStyle": "line", "fillOpacity": 0, "gradientMode": "none", "hideFrom": { "legend": false, "tooltip": false, "viz": false }, "insertNulls": false, "lineInterpolation": "linear", "lineWidth": 1, "pointSize": 5, "scaleDistribution": { "type": "linear" }, "showPoints": "auto", "spanNulls": false, "stacking": { "group": "A", "mode": "none" }, "thresholdsStyle": { "mode": "off" } }, "mappings": [], "thresholds": { "mode": "absolute", "steps": [ { "color": "green", "value": null }, { "color": "red", "value": 80 } ] } }, "overrides": [] }, "gridPos": { "h": 8, "w": 12, "x": 0, "y": 53 }, "id": 8, "options": { "legend": { "calcs": [], "displayMode": "list", "placement": "bottom", "showLegend": true }, "tooltip": { "mode": "single", "sort": "none" } }, "targets": [ { "datasource": { "type": "prometheus", "uid": "prometheus" }, "disableTextWrap": false, "editorMode": "builder", "expr": "sum by(__name__) (task_execution_total{status=\"FAILED\", includeRetries=\"true\"})", "fullMetaSearch": false, "includeNullMetadata": true, "instant": false, "legendFormat": "__auto", "range": true, "refId": "A", "useBackend": false } ], "title": "Task Failed Total", "type": "timeseries" }, { "datasource": { "type": "prometheus", "uid": "prometheus" }, "fieldConfig": { "defaults": { "color": { "mode": "palette-classic" }, "custom": { "axisBorderShow": false, "axisCenteredZero": false, "axisColorMode": "text", "axisLabel": "", "axisPlacement": "auto", "barAlignment": 0, "drawStyle": "line", "fillOpacity": 0, "gradientMode": "none", "hideFrom": { "legend": false, "tooltip": false, "viz": false }, "insertNulls": false, "lineInterpolation": "linear", "lineWidth": 1, "pointSize": 5, "scaleDistribution": { "type": "linear" }, "showPoints": "auto", "spanNulls": false, "stacking": { "group": "A", "mode": "none" }, "thresholdsStyle": { "mode": "off" } }, "mappings": [], "thresholds": { "mode": "absolute", "steps": [ { "color": "green", "value": null }, { "color": "red", "value": 80 } ] } }, "overrides": [] }, "gridPos": { "h": 8, "w": 12, "x": 12, "y": 53 }, "id": 5, "options": { "legend": { "calcs": [], "displayMode": "list", "placement": "bottom", "showLegend": true }, "tooltip": { "mode": "single", "sort": "none" } }, "targets": [ { "datasource": { "type": "prometheus", "uid": "prometheus" }, "disableTextWrap": false, "editorMode": "builder", "exemplar": false, "expr": "sum by(__name__) (task_execution_total{includeRetries=\"true\"})", "format": "time_series", "fullMetaSearch": false, "includeNullMetadata": false, "instant": false, "interval": "0.1s", "legendFormat": "Total Executed Tasks", "range": true, "refId": "A", "useBackend": false } ], "title": "Task Execution Total", "type": "timeseries" }, { "datasource": { "type": "prometheus", "uid": "prometheus" }, "fieldConfig": { "defaults": { "color": { "mode": "palette-classic" }, "custom": { "axisBorderShow": false, "axisCenteredZero": false, "axisColorMode": "text", "axisLabel": "", "axisPlacement": "auto", "barAlignment": 0, "drawStyle": "line", "fillOpacity": 0, "gradientMode": "none", "hideFrom": { "legend": false, "tooltip": false, "viz": false }, "insertNulls": false, "lineInterpolation": "linear", "lineWidth": 1, "pointSize": 5, "scaleDistribution": { "type": "linear" }, "showPoints": "auto", "spanNulls": false, "stacking": { "group": "A", "mode": "none" }, "thresholdsStyle": { "mode": "off" } }, "mappings": [], "thresholds": { "mode": "absolute", "steps": [ { "color": "green", "value": null }, { "color": "red", "value": 80 } ] } }, "overrides": [] }, "gridPos": { "h": 8, "w": 12, "x": 0, "y": 61 }, "id": 6, "options": { "legend": { "calcs": [], "displayMode": "list", "placement": "bottom", "showLegend": true }, "tooltip": { "mode": "single", "sort": "none" } }, "targets": [ { "datasource": { "type": "prometheus", "uid": "prometheus" }, "disableTextWrap": false, "editorMode": "builder", "expr": "sum by(__name__) (task_queue_wait_total)", "fullMetaSearch": false, "includeNullMetadata": true, "instant": false, "legendFormat": "Total Task Queue Wait Time", "range": true, "refId": "A", "useBackend": false } ], "title": "Task Queue Wait Total", "type": "timeseries" }, { "datasource": { "type": "prometheus", "uid": "prometheus" }, "fieldConfig": { "defaults": { "color": { "mode": "palette-classic" }, "custom": { "axisBorderShow": false, "axisCenteredZero": false, "axisColorMode": "text", "axisLabel": "", "axisPlacement": "auto", "barAlignment": 0, "drawStyle": "line", "fillOpacity": 0, "gradientMode": "none", "hideFrom": { "legend": false, "tooltip": false, "viz": false }, "insertNulls": false, "lineInterpolation": "linear", "lineWidth": 1, "pointSize": 5, "scaleDistribution": { "type": "linear" }, "showPoints": "auto", "spanNulls": false, "stacking": { "group": "A", "mode": "none" }, "thresholdsStyle": { "mode": "off" } }, "mappings": [], "thresholds": { "mode": "absolute", "steps": [ { "color": "green", "value": null }, { "color": "red", "value": 80 } ] } }, "overrides": [] }, "gridPos": { "h": 8, "w": 12, "x": 12, "y": 61 }, "id": 4, "options": { "legend": { "calcs": [], "displayMode": "list", "placement": "bottom", "showLegend": true }, "tooltip": { "mode": "single", "sort": "none" } }, "targets": [ { "datasource": { "type": "prometheus", "uid": "prometheus" }, "disableTextWrap": false, "editorMode": "builder", "expr": "task_queue_depth", "fullMetaSearch": false, "includeNullMetadata": true, "instant": false, "legendFormat": "{{taskType}}", "range": true, "refId": "A", "useBackend": false } ], "title": "Task Queue Depth", "type": "timeseries" } ], "refresh": "", "schemaVersion": 39, "tags": [], "templating": { "list": [] }, "time": { "from": "now-6h", "to": "now" }, "timepicker": {}, "timezone": "browser", "title": "Conductor", "uid": "fdr37xnr1k16oa", "version": 42, "weekStart": ""}VLLM Metrics
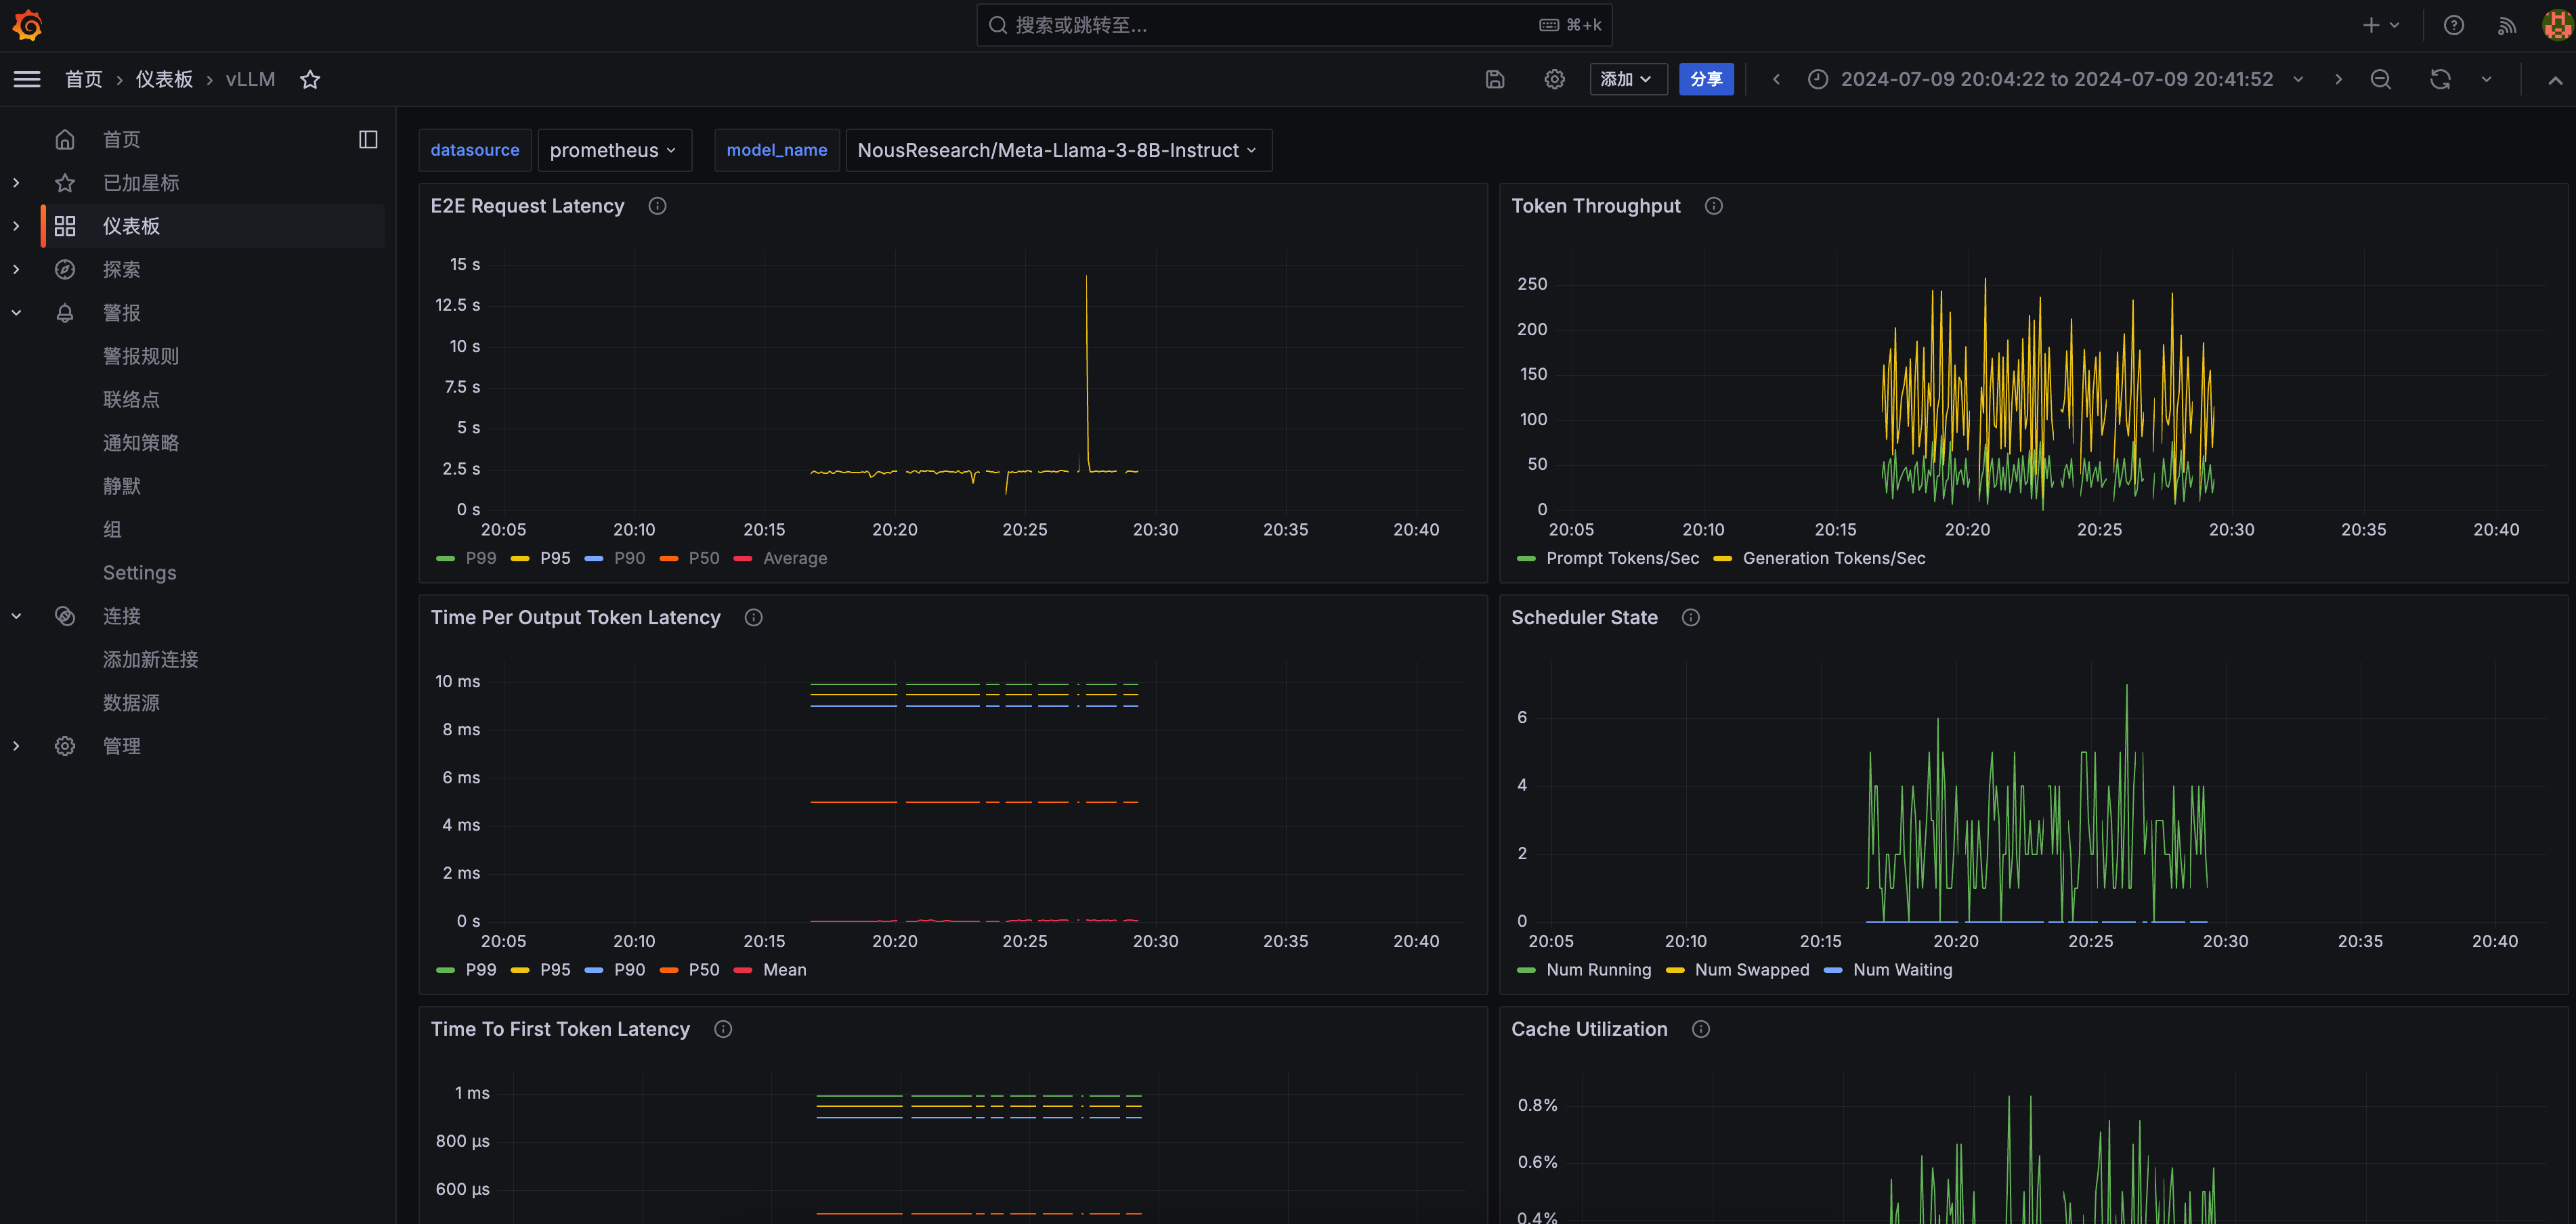
VLLM is used to deploy and manage large language models compatible with OpenAI’s API, exposing metrics such as model loading time, inference time, and memory usage.
Demonstration
Prometheus Configuration
Add the following configuration to the Prometheus configuration file:
global.scrape_interval: Monitoring interval, recommended to be5s.scrape_configs[].metrics_path: The Prometheus metrics endpoint for VLLM is/metrics.scrape_configs[].static_configs[].targets: The address and port of the VLLM service, you may need to modify it according to the actual deployment.
global:  scrape_interval: 1s
scrape_configs:  - job_name: 'vllm'    metrics_path: '/metrics'    static_configs:      - targets: ['vllm-service:8000']
Grafana Configuration
Configure Prometheus Data Source
- In the Grafana console, go to Connections - Data Sources and add a Prometheus data source:
- Prometheus server URL: Enter the address and port of the Prometheus service.
- Scrape interval: Monitoring interval, recommended to be the shortest interval (1s).
- Click Save & Test to save and test if the Prometheus data source is configured correctly.
- Import the monitoring dashboard
- In the Grafana console, go to the Dashboard page, click the New button.
- Select the Import option.
- Import the following JSON model through the dashboard JSON model
Expand JSON Content
JSON content from https://github.com/vllm-project/vllm/blob/main/examples/production_monitoring/grafana.json
{ "__inputs": [ ], "__elements": {}, "__requires": [ { "type": "grafana", "id": "grafana", "name": "Grafana", "version": "10.4.2" }, { "type": "panel", "id": "heatmap", "name": "Heatmap", "version": "" }, { "type": "datasource", "id": "prometheus", "name": "Prometheus", "version": "1.0.0" }, { "type": "panel", "id": "timeseries", "name": "Time series", "version": "" } ], "annotations": { "list": [ { "builtIn": 1, "datasource": { "type": "grafana", "uid": "-- Grafana --" }, "enable": true, "hide": true, "iconColor": "rgba(0, 211, 255, 1)", "name": "Annotations & Alerts", "target": { "limit": 100, "matchAny": false, "tags": [], "type": "dashboard" }, "type": "dashboard" } ] }, "description": "Monitoring vLLM Inference Server", "editable": true, "fiscalYearStartMonth": 0, "graphTooltip": 0, "id": null, "links": [], "liveNow": false, "panels": [ { "datasource": { "type": "prometheus", "uid": "${DS_PROMETHEUS}" }, "description": "End to end request latency measured in seconds.", "fieldConfig": { "defaults": { "color": { "mode": "palette-classic" }, "custom": { "axisBorderShow": false, "axisCenteredZero": false, "axisColorMode": "text", "axisLabel": "", "axisPlacement": "auto", "barAlignment": 0, "drawStyle": "line", "fillOpacity": 0, "gradientMode": "none", "hideFrom": { "legend": false, "tooltip": false, "viz": false }, "insertNulls": false, "lineInterpolation": "linear", "lineWidth": 1, "pointSize": 5, "scaleDistribution": { "type": "linear" }, "showPoints": "auto", "spanNulls": false, "stacking": { "group": "A", "mode": "none" }, "thresholdsStyle": { "mode": "off" } }, "mappings": [], "thresholds": { "mode": "absolute", "steps": [ { "color": "green", "value": null }, { "color": "red", "value": 80 } ] }, "unit": "s" }, "overrides": [] }, "gridPos": { "h": 8, "w": 12, "x": 0, "y": 0 }, "id": 9, "options": { "legend": { "calcs": [], "displayMode": "list", "placement": "bottom", "showLegend": true }, "tooltip": { "mode": "single", "sort": "none" } }, "targets": [ { "datasource": { "type": "prometheus", "uid": "${DS_PROMETHEUS}" }, "disableTextWrap": false, "editorMode": "builder", "expr": "histogram_quantile(0.99, sum by(le) (rate(vllm:e2e_request_latency_seconds_bucket{model_name=\"$model_name\"}[$__rate_interval])))", "fullMetaSearch": false, "includeNullMetadata": false, "instant": false, "legendFormat": "P99", "range": true, "refId": "A", "useBackend": false }, { "datasource": { "type": "prometheus", "uid": "${DS_PROMETHEUS}" }, "disableTextWrap": false, "editorMode": "builder", "expr": "histogram_quantile(0.95, sum by(le) (rate(vllm:e2e_request_latency_seconds_bucket{model_name=\"$model_name\"}[$__rate_interval])))", "fullMetaSearch": false, "hide": false, "includeNullMetadata": false, "instant": false, "legendFormat": "P95", "range": true, "refId": "B", "useBackend": false }, { "datasource": { "type": "prometheus", "uid": "${DS_PROMETHEUS}" }, "disableTextWrap": false, "editorMode": "builder", "expr": "histogram_quantile(0.9, sum by(le) (rate(vllm:e2e_request_latency_seconds_bucket{model_name=\"$model_name\"}[$__rate_interval])))", "fullMetaSearch": false, "hide": false, "includeNullMetadata": false, "instant": false, "legendFormat": "P90", "range": true, "refId": "C", "useBackend": false }, { "datasource": { "type": "prometheus", "uid": "${DS_PROMETHEUS}" }, "disableTextWrap": false, "editorMode": "builder", "expr": "histogram_quantile(0.5, sum by(le) (rate(vllm:e2e_request_latency_seconds_bucket{model_name=\"$model_name\"}[$__rate_interval])))", "fullMetaSearch": false, "hide": false, "includeNullMetadata": false, "instant": false, "legendFormat": "P50", "range": true, "refId": "D", "useBackend": false }, { "datasource": { "type": "prometheus", "uid": "${DS_PROMETHEUS}" }, "editorMode": "code", "expr": "rate(vllm:e2e_request_latency_seconds_sum{model_name=\"$model_name\"}[$__rate_interval])\n/\nrate(vllm:e2e_request_latency_seconds_count{model_name=\"$model_name\"}[$__rate_interval])", "hide": false, "instant": false, "legendFormat": "Average", "range": true, "refId": "E" } ], "title": "E2E Request Latency", "type": "timeseries" }, { "datasource": { "type": "prometheus", "uid": "${DS_PROMETHEUS}" }, "description": "Number of tokens processed per second", "fieldConfig": { "defaults": { "color": { "mode": "palette-classic" }, "custom": { "axisBorderShow": false, "axisCenteredZero": false, "axisColorMode": "text", "axisLabel": "", "axisPlacement": "auto", "barAlignment": 0, "drawStyle": "line", "fillOpacity": 0, "gradientMode": "none", "hideFrom": { "legend": false, "tooltip": false, "viz": false }, "insertNulls": false, "lineInterpolation": "linear", "lineWidth": 1, "pointSize": 5, "scaleDistribution": { "type": "linear" }, "showPoints": "auto", "spanNulls": false, "stacking": { "group": "A", "mode": "none" }, "thresholdsStyle": { "mode": "off" } }, "mappings": [], "thresholds": { "mode": "absolute", "steps": [ { "color": "green", "value": null }, { "color": "red", "value": 80 } ] } }, "overrides": [] }, "gridPos": { "h": 8, "w": 12, "x": 12, "y": 0 }, "id": 8, "options": { "legend": { "calcs": [], "displayMode": "list", "placement": "bottom", "showLegend": true }, "tooltip": { "mode": "single", "sort": "none" } }, "targets": [ { "datasource": { "type": "prometheus", "uid": "${DS_PROMETHEUS}" }, "disableTextWrap": false, "editorMode": "builder", "expr": "rate(vllm:prompt_tokens_total{model_name=\"$model_name\"}[$__rate_interval])", "fullMetaSearch": false, "includeNullMetadata": false, "instant": false, "legendFormat": "Prompt Tokens/Sec", "range": true, "refId": "A", "useBackend": false }, { "datasource": { "type": "prometheus", "uid": "${DS_PROMETHEUS}" }, "disableTextWrap": false, "editorMode": "builder", "expr": "rate(vllm:generation_tokens_total{model_name=\"$model_name\"}[$__rate_interval])", "fullMetaSearch": false, "hide": false, "includeNullMetadata": false, "instant": false, "legendFormat": "Generation Tokens/Sec", "range": true, "refId": "B", "useBackend": false } ], "title": "Token Throughput", "type": "timeseries" }, { "datasource": { "type": "prometheus", "uid": "${DS_PROMETHEUS}" }, "description": "Inter token latency in seconds.", "fieldConfig": { "defaults": { "color": { "mode": "palette-classic" }, "custom": { "axisBorderShow": false, "axisCenteredZero": false, "axisColorMode": "text", "axisLabel": "", "axisPlacement": "auto", "barAlignment": 0, "drawStyle": "line", "fillOpacity": 0, "gradientMode": "none", "hideFrom": { "legend": false, "tooltip": false, "viz": false }, "insertNulls": false, "lineInterpolation": "linear", "lineWidth": 1, "pointSize": 5, "scaleDistribution": { "type": "linear" }, "showPoints": "auto", "spanNulls": false, "stacking": { "group": "A", "mode": "none" }, "thresholdsStyle": { "mode": "off" } }, "mappings": [], "thresholds": { "mode": "absolute", "steps": [ { "color": "green", "value": null }, { "color": "red", "value": 80 } ] }, "unit": "s" }, "overrides": [] }, "gridPos": { "h": 8, "w": 12, "x": 0, "y": 8 }, "id": 10, "options": { "legend": { "calcs": [], "displayMode": "list", "placement": "bottom", "showLegend": true }, "tooltip": { "mode": "single", "sort": "none" } }, "targets": [ { "datasource": { "type": "prometheus", "uid": "${DS_PROMETHEUS}" }, "disableTextWrap": false, "editorMode": "builder", "expr": "histogram_quantile(0.99, sum by(le) (rate(vllm:time_per_output_token_seconds_bucket{model_name=\"$model_name\"}[$__rate_interval])))", "fullMetaSearch": false, "includeNullMetadata": false, "instant": false, "legendFormat": "P99", "range": true, "refId": "A", "useBackend": false }, { "datasource": { "type": "prometheus", "uid": "${DS_PROMETHEUS}" }, "disableTextWrap": false, "editorMode": "builder", "expr": "histogram_quantile(0.95, sum by(le) (rate(vllm:time_per_output_token_seconds_bucket{model_name=\"$model_name\"}[$__rate_interval])))", "fullMetaSearch": false, "hide": false, "includeNullMetadata": false, "instant": false, "legendFormat": "P95", "range": true, "refId": "B", "useBackend": false }, { "datasource": { "type": "prometheus", "uid": "${DS_PROMETHEUS}" }, "disableTextWrap": false, "editorMode": "builder", "expr": "histogram_quantile(0.9, sum by(le) (rate(vllm:time_per_output_token_seconds_bucket{model_name=\"$model_name\"}[$__rate_interval])))", "fullMetaSearch": false, "hide": false, "includeNullMetadata": false, "instant": false, "legendFormat": "P90", "range": true, "refId": "C", "useBackend": false }, { "datasource": { "type": "prometheus", "uid": "${DS_PROMETHEUS}" }, "disableTextWrap": false, "editorMode": "builder", "expr": "histogram_quantile(0.5, sum by(le) (rate(vllm:time_per_output_token_seconds_bucket{model_name=\"$model_name\"}[$__rate_interval])))", "fullMetaSearch": false, "hide": false, "includeNullMetadata": false, "instant": false, "legendFormat": "P50", "range": true, "refId": "D", "useBackend": false }, { "datasource": { "type": "prometheus", "uid": "${DS_PROMETHEUS}" }, "editorMode": "code", "expr": "rate(vllm:time_per_output_token_seconds_sum{model_name=\"$model_name\"}[$__rate_interval])\n/\nrate(vllm:time_per_output_token_seconds_count{model_name=\"$model_name\"}[$__rate_interval])", "hide": false, "instant": false, "legendFormat": "Mean", "range": true, "refId": "E" } ], "title": "Time Per Output Token Latency", "type": "timeseries" }, { "datasource": { "type": "prometheus", "uid": "${DS_PROMETHEUS}" }, "description": "Number of requests in RUNNING, WAITING, and SWAPPED state", "fieldConfig": { "defaults": { "color": { "mode": "palette-classic" }, "custom": { "axisBorderShow": false, "axisCenteredZero": false, "axisColorMode": "text", "axisLabel": "", "axisPlacement": "auto", "barAlignment": 0, "drawStyle": "line", "fillOpacity": 0, "gradientMode": "none", "hideFrom": { "legend": false, "tooltip": false, "viz": false }, "insertNulls": false, "lineInterpolation": "linear", "lineWidth": 1, "pointSize": 5, "scaleDistribution": { "type": "linear" }, "showPoints": "auto", "spanNulls": false, "stacking": { "group": "A", "mode": "none" }, "thresholdsStyle": { "mode": "off" } }, "mappings": [], "thresholds": { "mode": "absolute", "steps": [ { "color": "green", "value": null }, { "color": "red", "value": 80 } ] }, "unit": "none" }, "overrides": [] }, "gridPos": { "h": 8, "w": 12, "x": 12, "y": 8 }, "id": 3, "options": { "legend": { "calcs": [], "displayMode": "list", "placement": "bottom", "showLegend": true }, "tooltip": { "mode": "single", "sort": "none" } }, "targets": [ { "datasource": { "type": "prometheus", "uid": "${DS_PROMETHEUS}" }, "disableTextWrap": false, "editorMode": "builder", "expr": "vllm:num_requests_running{model_name=\"$model_name\"}", "fullMetaSearch": false, "includeNullMetadata": true, "instant": false, "legendFormat": "Num Running", "range": true, "refId": "A", "useBackend": false }, { "datasource": { "type": "prometheus", "uid": "${DS_PROMETHEUS}" }, "disableTextWrap": false, "editorMode": "builder", "expr": "vllm:num_requests_swapped{model_name=\"$model_name\"}", "fullMetaSearch": false, "hide": false, "includeNullMetadata": true, "instant": false, "legendFormat": "Num Swapped", "range": true, "refId": "B", "useBackend": false }, { "datasource": { "type": "prometheus", "uid": "${DS_PROMETHEUS}" }, "disableTextWrap": false, "editorMode": "builder", "expr": "vllm:num_requests_waiting{model_name=\"$model_name\"}", "fullMetaSearch": false, "hide": false, "includeNullMetadata": true, "instant": false, "legendFormat": "Num Waiting", "range": true, "refId": "C", "useBackend": false } ], "title": "Scheduler State", "type": "timeseries" }, { "datasource": { "type": "prometheus", "uid": "${DS_PROMETHEUS}" }, "description": "P50, P90, P95, and P99 TTFT latency in seconds.", "fieldConfig": { "defaults": { "color": { "mode": "palette-classic" }, "custom": { "axisBorderShow": false, "axisCenteredZero": false, "axisColorMode": "text", "axisLabel": "", "axisPlacement": "auto", "barAlignment": 0, "drawStyle": "line", "fillOpacity": 0, "gradientMode": "none", "hideFrom": { "legend": false, "tooltip": false, "viz": false }, "insertNulls": false, "lineInterpolation": "linear", "lineWidth": 1, "pointSize": 5, "scaleDistribution": { "type": "linear" }, "showPoints": "auto", "spanNulls": false, "stacking": { "group": "A", "mode": "none" }, "thresholdsStyle": { "mode": "off" } }, "mappings": [], "thresholds": { "mode": "absolute", "steps": [ { "color": "green", "value": null }, { "color": "red", "value": 80 } ] }, "unit": "s" }, "overrides": [] }, "gridPos": { "h": 8, "w": 12, "x": 0, "y": 16 }, "id": 5, "options": { "legend": { "calcs": [], "displayMode": "list", "placement": "bottom", "showLegend": true }, "tooltip": { "mode": "single", "sort": "none" } }, "targets": [ { "datasource": { "type": "prometheus", "uid": "${DS_PROMETHEUS}" }, "disableTextWrap": false, "editorMode": "builder", "expr": "histogram_quantile(0.99, sum by(le) (rate(vllm:time_to_first_token_seconds_bucket{model_name=\"$model_name\"}[$__rate_interval])))", "fullMetaSearch": false, "hide": false, "includeNullMetadata": false, "instant": false, "legendFormat": "P99", "range": true, "refId": "A", "useBackend": false }, { "datasource": { "type": "prometheus", "uid": "${DS_PROMETHEUS}" }, "disableTextWrap": false, "editorMode": "builder", "expr": "histogram_quantile(0.95, sum by(le) (rate(vllm:time_to_first_token_seconds_bucket{model_name=\"$model_name\"}[$__rate_interval])))", "fullMetaSearch": false, "includeNullMetadata": false, "instant": false, "legendFormat": "P95", "range": true, "refId": "B", "useBackend": false }, { "datasource": { "type": "prometheus", "uid": "${DS_PROMETHEUS}" }, "disableTextWrap": false, "editorMode": "builder", "expr": "histogram_quantile(0.9, sum by(le) (rate(vllm:time_to_first_token_seconds_bucket{model_name=\"$model_name\"}[$__rate_interval])))", "fullMetaSearch": false, "hide": false, "includeNullMetadata": false, "instant": false, "legendFormat": "P90", "range": true, "refId": "C", "useBackend": false }, { "datasource": { "type": "prometheus", "uid": "${DS_PROMETHEUS}" }, "disableTextWrap": false, "editorMode": "builder", "expr": "histogram_quantile(0.5, sum by(le) (rate(vllm:time_to_first_token_seconds_bucket{model_name=\"$model_name\"}[$__rate_interval])))", "fullMetaSearch": false, "hide": false, "includeNullMetadata": false, "instant": false, "legendFormat": "P50", "range": true, "refId": "D", "useBackend": false }, { "datasource": { "type": "prometheus", "uid": "${DS_PROMETHEUS}" }, "editorMode": "code", "expr": "rate(vllm:time_to_first_token_seconds_sum{model_name=\"$model_name\"}[$__rate_interval])\n/\nrate(vllm:time_to_first_token_seconds_count{model_name=\"$model_name\"}[$__rate_interval])", "hide": false, "instant": false, "legendFormat": "Average", "range": true, "refId": "E" } ], "title": "Time To First Token Latency", "type": "timeseries" }, { "datasource": { "type": "prometheus", "uid": "${DS_PROMETHEUS}" }, "description": "Percentage of used cache blocks by vLLM.", "fieldConfig": { "defaults": { "color": { "mode": "palette-classic" }, "custom": { "axisBorderShow": false, "axisCenteredZero": false, "axisColorMode": "text", "axisLabel": "", "axisPlacement": "auto", "barAlignment": 0, "drawStyle": "line", "fillOpacity": 0, "gradientMode": "none", "hideFrom": { "legend": false, "tooltip": false, "viz": false }, "insertNulls": false, "lineInterpolation": "linear", "lineWidth": 1, "pointSize": 5, "scaleDistribution": { "type": "linear" }, "showPoints": "auto", "spanNulls": false, "stacking": { "group": "A", "mode": "none" }, "thresholdsStyle": { "mode": "off" } }, "mappings": [], "thresholds": { "mode": "absolute", "steps": [ { "color": "green", "value": null }, { "color": "red", "value": 80 } ] }, "unit": "percentunit" }, "overrides": [] }, "gridPos": { "h": 8, "w": 12, "x": 12, "y": 16 }, "id": 4, "options": { "legend": { "calcs": [], "displayMode": "list", "placement": "bottom", "showLegend": true }, "tooltip": { "mode": "single", "sort": "none" } }, "targets": [ { "datasource": { "type": "prometheus", "uid": "${DS_PROMETHEUS}" }, "editorMode": "code", "expr": "vllm:gpu_cache_usage_perc{model_name=\"$model_name\"}", "instant": false, "legendFormat": "GPU Cache Usage", "range": true, "refId": "A" }, { "datasource": { "type": "prometheus", "uid": "${DS_PROMETHEUS}" }, "editorMode": "code", "expr": "vllm:cpu_cache_usage_perc{model_name=\"$model_name\"}", "hide": false, "instant": false, "legendFormat": "CPU Cache Usage", "range": true, "refId": "B" } ], "title": "Cache Utilization", "type": "timeseries" }, { "datasource": { "type": "prometheus", "uid": "${DS_PROMETHEUS}" }, "description": "Heatmap of request prompt length", "fieldConfig": { "defaults": { "custom": { "hideFrom": { "legend": false, "tooltip": false, "viz": false }, "scaleDistribution": { "type": "linear" } } }, "overrides": [] }, "gridPos": { "h": 8, "w": 12, "x": 0, "y": 24 }, "id": 12, "options": { "calculate": false, "cellGap": 1, "cellValues": { "unit": "none" }, "color": { "exponent": 0.5, "fill": "dark-orange", "min": 0, "mode": "scheme", "reverse": false, "scale": "exponential", "scheme": "Spectral", "steps": 64 }, "exemplars": { "color": "rgba(255,0,255,0.7)" }, "filterValues": { "le": 1e-9 }, "legend": { "show": true }, "rowsFrame": { "layout": "auto", "value": "Request count" }, "tooltip": { "mode": "single", "showColorScale": false, "yHistogram": true }, "yAxis": { "axisLabel": "Prompt Length", "axisPlacement": "left", "reverse": false, "unit": "none" } }, "pluginVersion": "10.4.2", "targets": [ { "datasource": { "type": "prometheus", "uid": "${DS_PROMETHEUS}" }, "disableTextWrap": false, "editorMode": "builder", "expr": "sum by(le) (increase(vllm:request_prompt_tokens_bucket{model_name=\"$model_name\"}[$__rate_interval]))", "format": "heatmap", "fullMetaSearch": false, "includeNullMetadata": true, "instant": false, "legendFormat": "{{le}}", "range": true, "refId": "A", "useBackend": false } ], "title": "Request Prompt Length", "type": "heatmap" }, { "datasource": { "type": "prometheus", "uid": "${DS_PROMETHEUS}" }, "description": "Heatmap of request generation length", "fieldConfig": { "defaults": { "custom": { "hideFrom": { "legend": false, "tooltip": false, "viz": false }, "scaleDistribution": { "type": "linear" } } }, "overrides": [] }, "gridPos": { "h": 8, "w": 12, "x": 12, "y": 24 }, "id": 13, "options": { "calculate": false, "cellGap": 1, "cellValues": { "unit": "none" }, "color": { "exponent": 0.5, "fill": "dark-orange", "min": 0, "mode": "scheme", "reverse": false, "scale": "exponential", "scheme": "Spectral", "steps": 64 }, "exemplars": { "color": "rgba(255,0,255,0.7)" }, "filterValues": { "le": 1e-9 }, "legend": { "show": true }, "rowsFrame": { "layout": "auto", "value": "Request count" }, "tooltip": { "mode": "single", "showColorScale": false, "yHistogram": true }, "yAxis": { "axisLabel": "Generation Length", "axisPlacement": "left", "reverse": false, "unit": "none" } }, "pluginVersion": "10.4.2", "targets": [ { "datasource": { "type": "prometheus", "uid": "${DS_PROMETHEUS}" }, "disableTextWrap": false, "editorMode": "builder", "expr": "sum by(le) (increase(vllm:request_generation_tokens_bucket{model_name=\"$model_name\"}[$__rate_interval]))", "format": "heatmap", "fullMetaSearch": false, "includeNullMetadata": true, "instant": false, "legendFormat": "{{le}}", "range": true, "refId": "A", "useBackend": false } ], "title": "Request Generation Length", "type": "heatmap" }, { "datasource": { "type": "prometheus", "uid": "${DS_PROMETHEUS}" }, "description": "Number of finished requests by their finish reason: either an EOS token was generated or the max sequence length was reached.", "fieldConfig": { "defaults": { "color": { "mode": "palette-classic" }, "custom": { "axisBorderShow": false, "axisCenteredZero": false, "axisColorMode": "text", "axisLabel": "", "axisPlacement": "auto", "barAlignment": 0, "drawStyle": "line", "fillOpacity": 0, "gradientMode": "none", "hideFrom": { "legend": false, "tooltip": false, "viz": false }, "insertNulls": false, "lineInterpolation": "linear", "lineWidth": 1, "pointSize": 5, "scaleDistribution": { "type": "linear" }, "showPoints": "auto", "spanNulls": false, "stacking": { "group": "A", "mode": "none" }, "thresholdsStyle": { "mode": "off" } }, "mappings": [], "thresholds": { "mode": "absolute", "steps": [ { "color": "green", "value": null }, { "color": "red", "value": 80 } ] } }, "overrides": [] }, "gridPos": { "h": 8, "w": 12, "x": 0, "y": 32 }, "id": 11, "options": { "legend": { "calcs": [], "displayMode": "list", "placement": "bottom", "showLegend": true }, "tooltip": { "mode": "single", "sort": "none" } }, "targets": [ { "datasource": { "type": "prometheus", "uid": "${DS_PROMETHEUS}" }, "disableTextWrap": false, "editorMode": "builder", "expr": "sum by(finished_reason) (increase(vllm:request_success_total{model_name=\"$model_name\"}[$__rate_interval]))", "fullMetaSearch": false, "includeNullMetadata": true, "instant": false, "interval": "", "legendFormat": "__auto", "range": true, "refId": "A", "useBackend": false } ], "title": "Finish Reason", "type": "timeseries" } ], "refresh": "", "schemaVersion": 39, "tags": [], "templating": { "list": [ { "type": "datasource", "name": "DS_PROMETHEUS", "label": "datasource", "current": {}, "hide": 0, "includeAll": false, "multi": false, "options": [], "query": "prometheus", "queryValue": "", "refresh": 1, "regex": "", "skipUrlSync": false }, { "definition": "label_values(model_name)", "hide": 0, "includeAll": false, "label": "model_name", "multi": false, "name": "model_name", "options": [], "query": { "query": "label_values(model_name)", "refId": "StandardVariableQuery" }, "refresh": 1, "regex": "", "skipUrlSync": false, "sort": 0, "type": "query" } ] }, "time": { "from": "now-5m", "to": "now" }, "timepicker": {}, "timezone": "", "title": "vLLM", "uid": "b281712d-8bff-41ef-9f3f-71ad43c05e9b", "version": 1, "weekStart": ""}